About DecoPath
Background
One of the more conventional methods to guide the interpretation of data generated by high throughput (HT) technologies is determining if sets of differentially expressed genes might be associated with a given biological process or a phenotype. This can commonly be done through a pathway analysis, such as gene set enrichment analysis (GSEA) or over representation analysis (ORA). While pathway analysis has certainly become a highly popular approach, pathway boundaries can be loosely defined across pathway databases and the selection of a particular database can come with an important caveat: the choice of database can impact the results of various pathway analysis.
To shed light on what exactly a researcher can expect when they use a particular database for a pathway analysis over another, we’ve developed DecoPath, a web application that can be used to identify where differences lie by comparing the results generated when pathways from different resources are used.
DecoPath is an intuitive and extensible web application which allows users to easily identify where these differences lie and which pathways are you can identify where these differences lie by directly comparing results generated when pathways from different resources are used.
See our publication for more information.
Is DecoPath the right tool for me?
The experimental design of a pathway analysis is a crucial first step in ensuring the results of an analysis are meaningful. DecoPath is the right tool for you to:
- Intuitively interpret the results of pathway analysis yielded by some of the most of the well-known open-sourced pathway databases
- Conduct or upload results of pathway analysis with variable experimental design implementations to easily identify inconsistencies across results
DecoPath workflow
A typical DecoPath workflow consists of setting the configuration of an experiment, uploading the required files to run it and finally, navigating to the experiments page to explore the results.
By default, DecoPath includes 4 major pathway databases for pathway gene sets (see imprint):
Details on each step of the workflow can be found below.
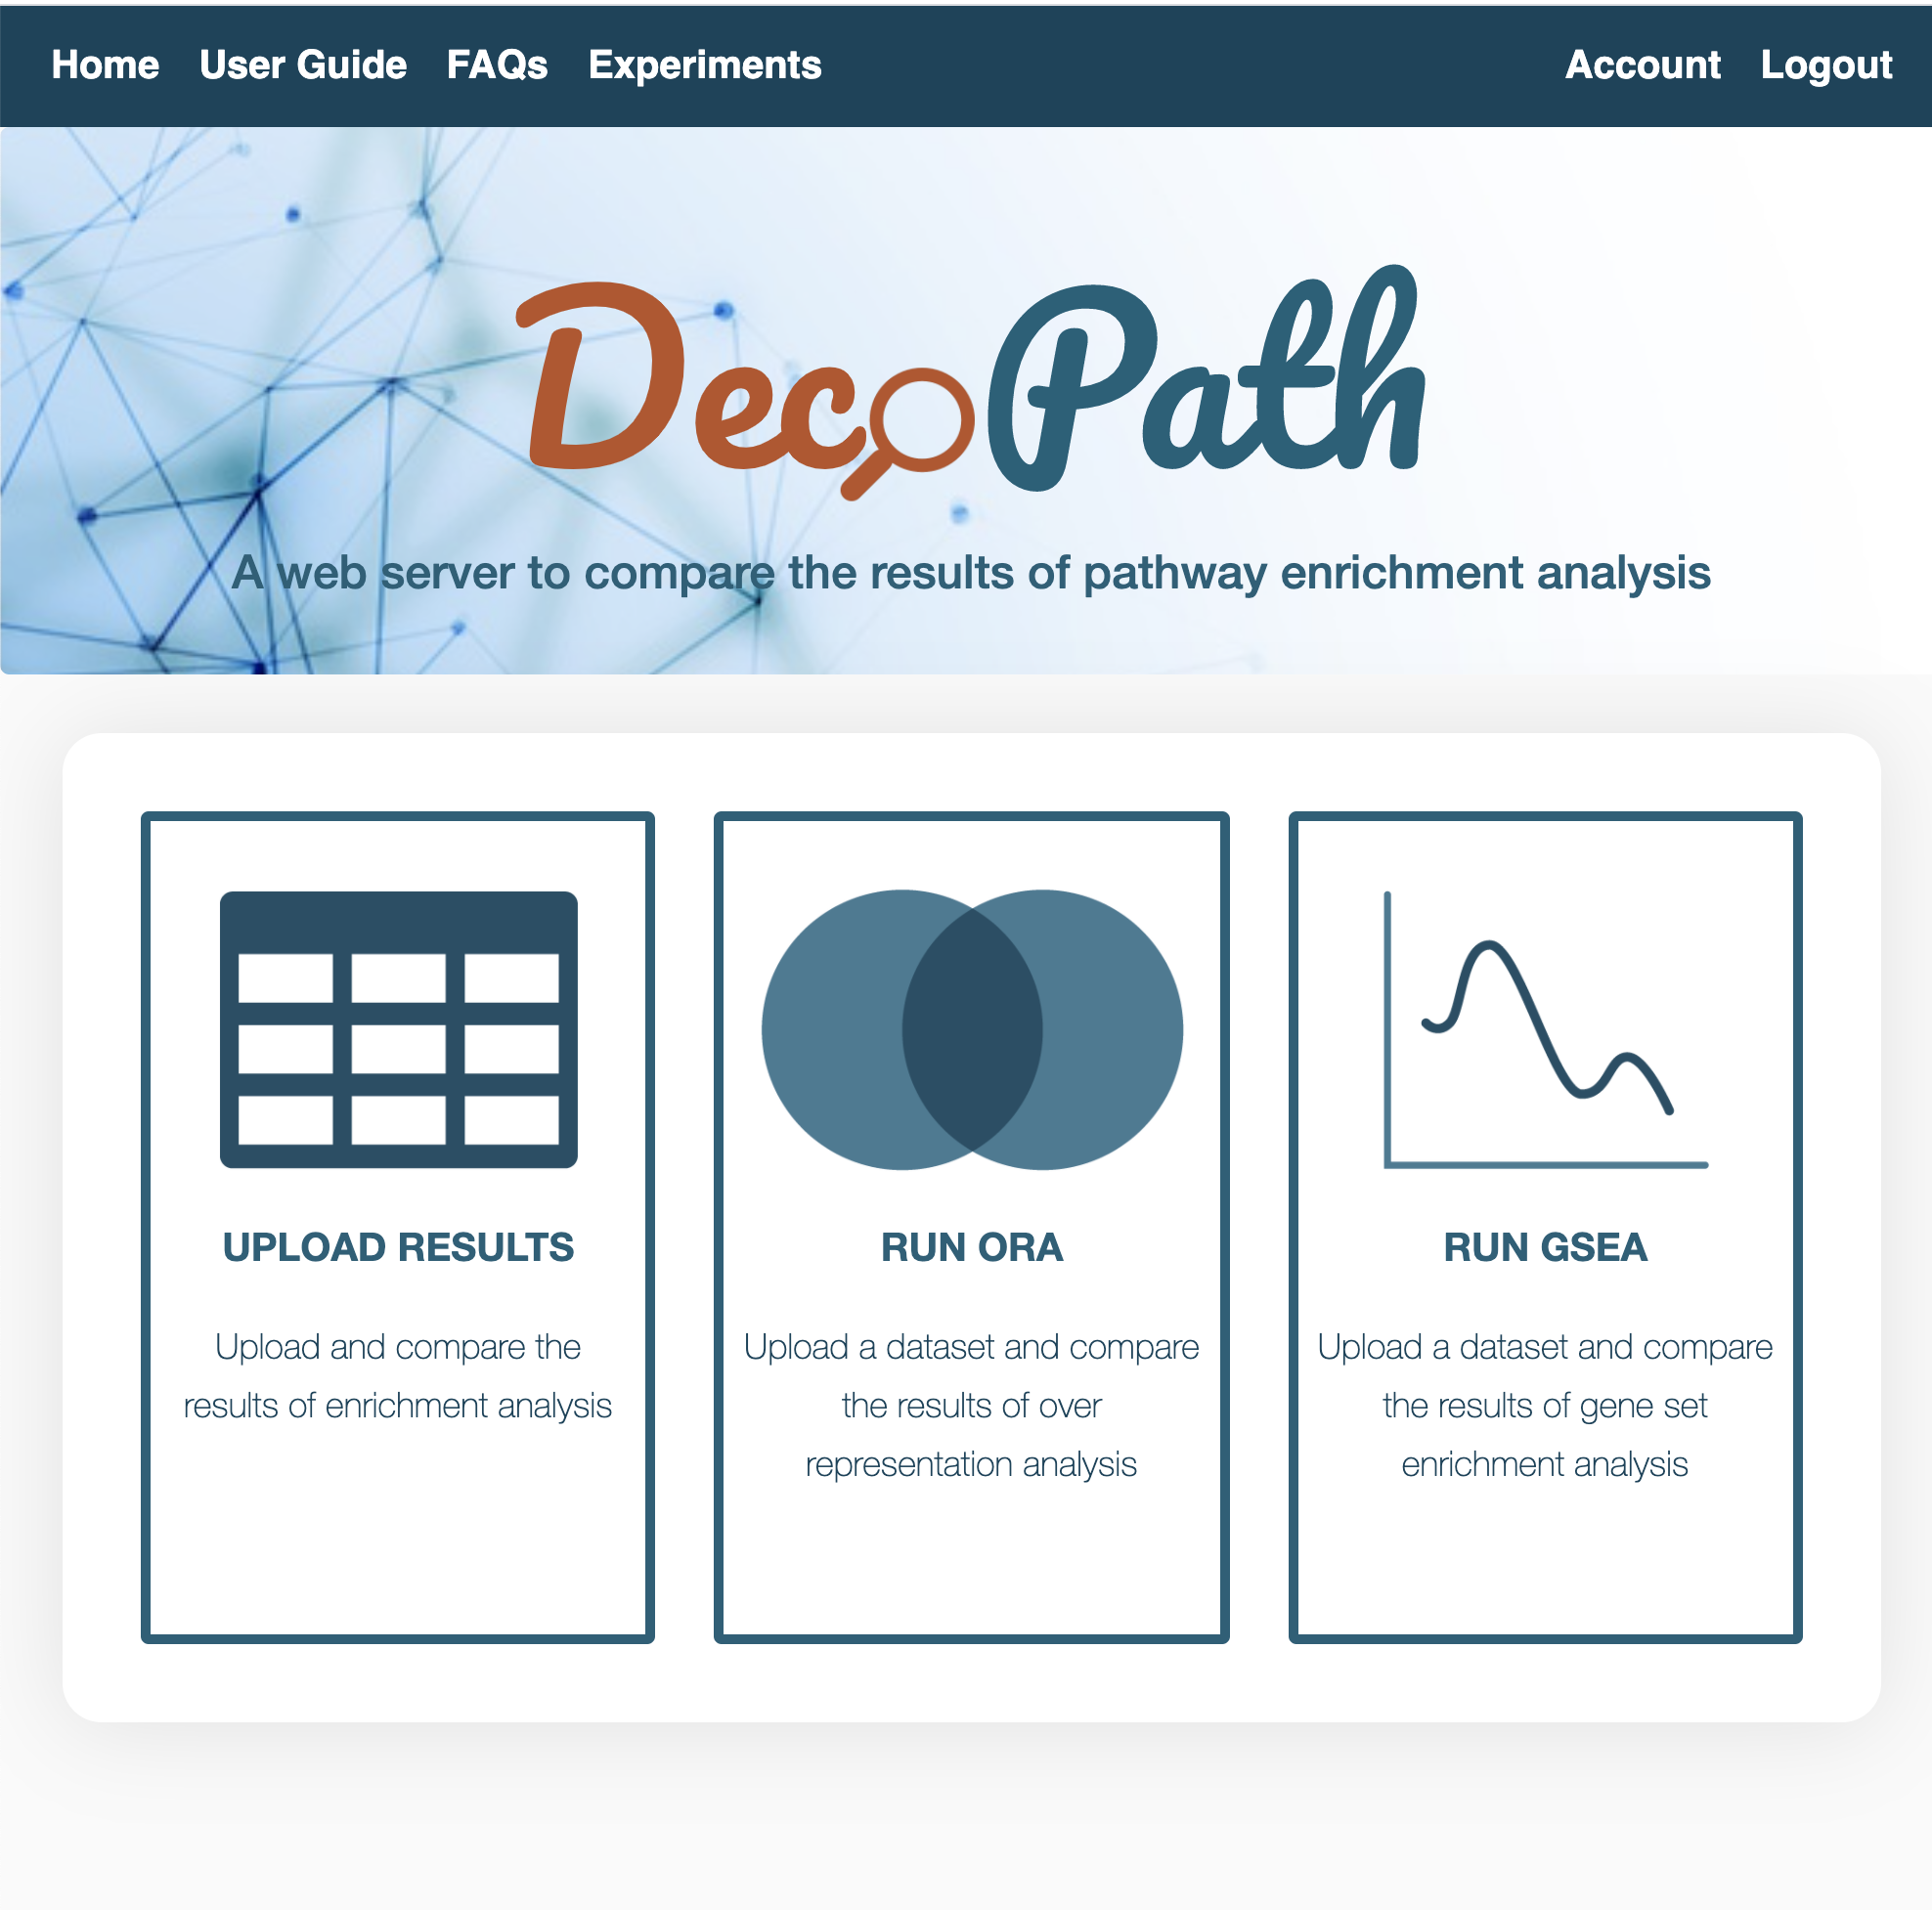
DecoPath home page
Run experiments
Explore results
Test run
ORA test run
You can view and explore the results of running ORA on multiple databases for a liver cancer dataset by downloading the file, ORA results. Then, select ORA as the enrichment method in Step 2 of the Upload Results section of the home page and upload this file.
You can also download the fold changes for genes from the same liver cancer dataset here for an an additional, gene-level analysis. Then, in Step 3, select "Upload differential gene expression analysis results" and upload this file.
Click submit and you can then view the results on the Experiments page.
GSEA test run
You can view and explore the results of running GSEA on multiple databases for a liver cancer dataset by downloading the file, GSEA results. Then, select GSEA as the enrichment method in Step 2 of the Upload Results section of the home page and upload this file.
You can also download the fold changes for genes from the same liver cancer dataset here for an an additional, gene-level analysis. Then, in Step 3, select "Upload differential gene expression analysis results" and upload this file.
Click submit and you can then view the results on the Experiments page.
Running an experiment
Overview
Users have 2 options to run an experiment:
- Upload the results of a pathway enrichment analysis
- Conduct a pathway enrichment analysis using DecoPath
Upload results
Run ORA
Run GSEA
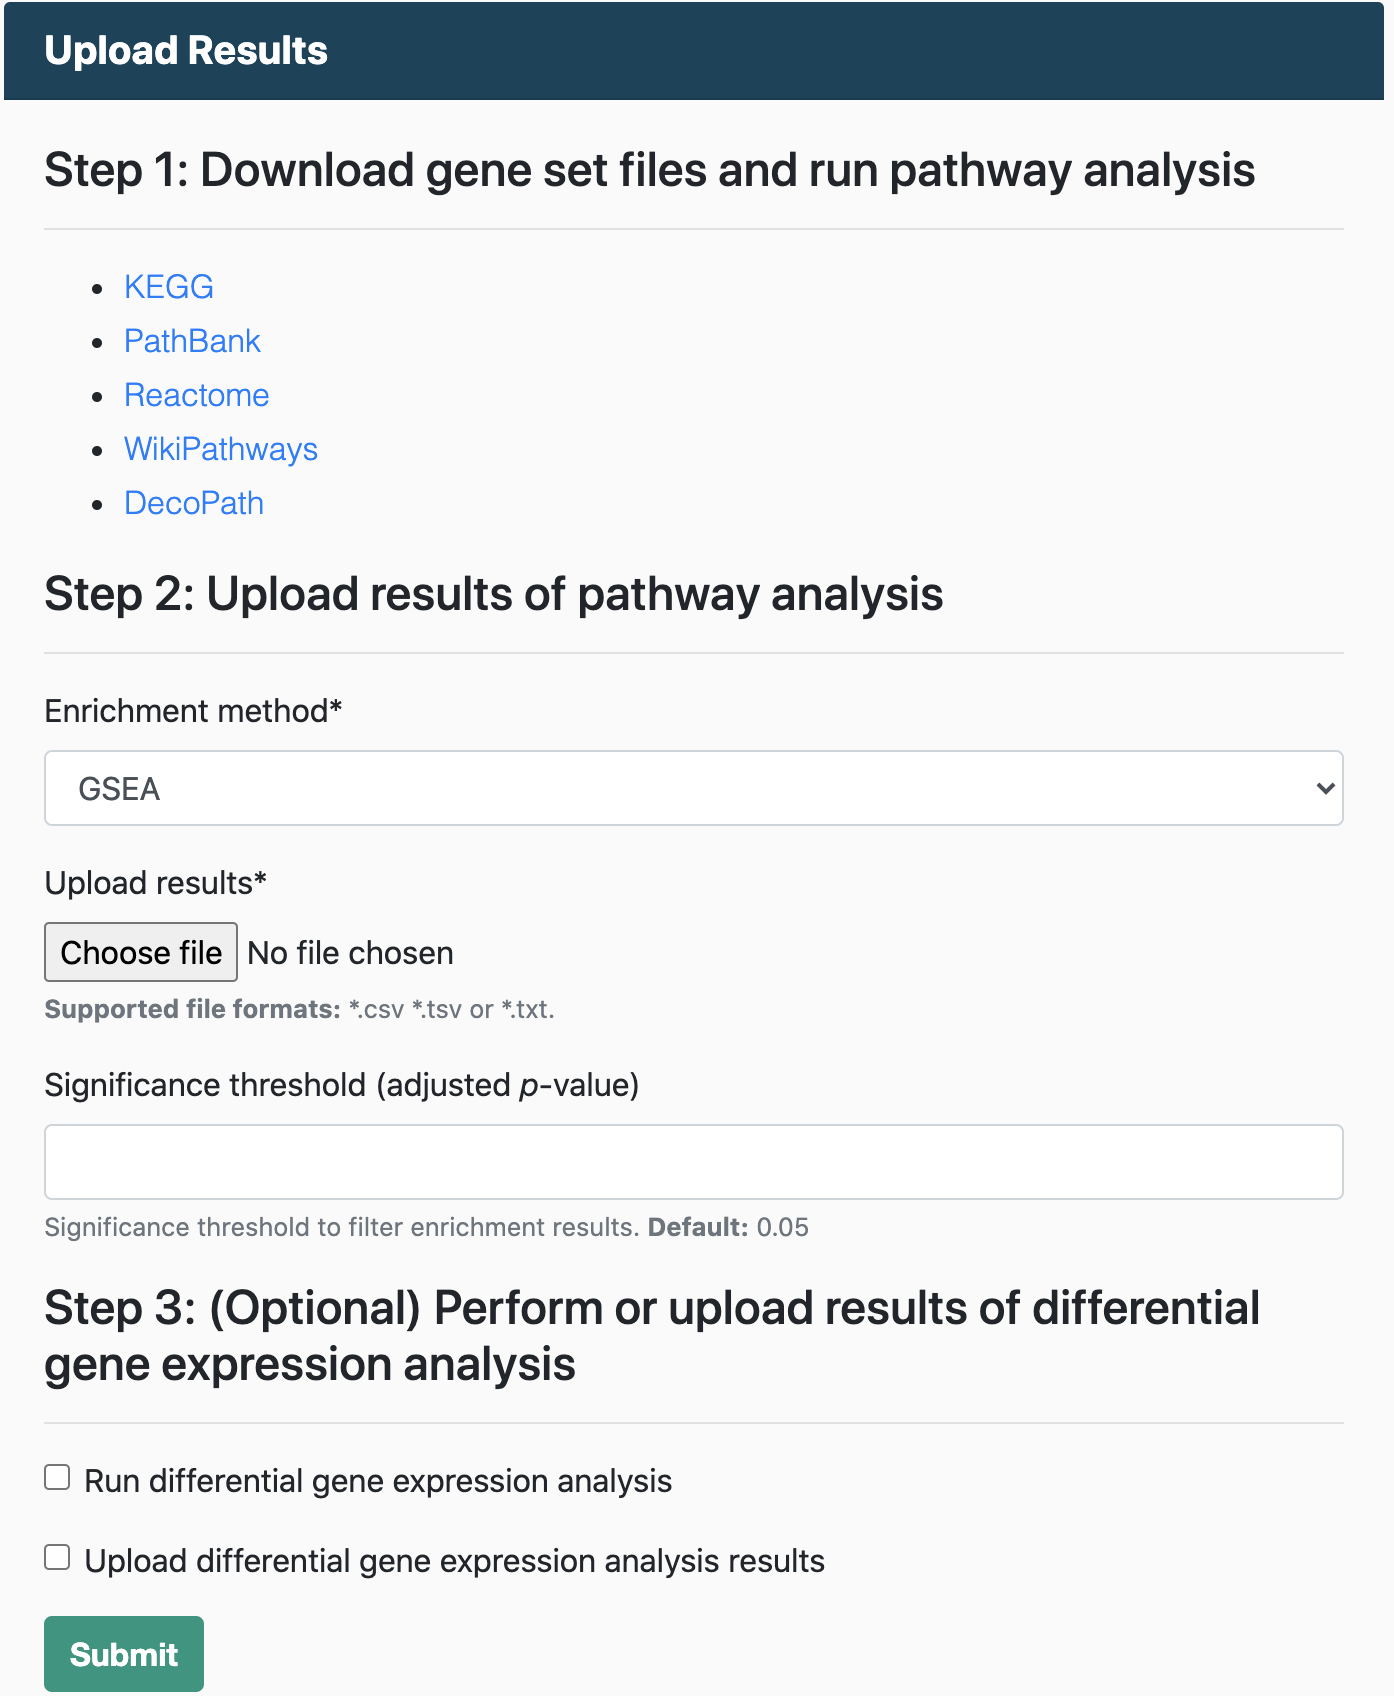
Upload enrichment results
You can submit the results of an enrichment analysis and use the DecoPath visualizations and functionalities to compare and explore the consensus and discrepancies around different pathway databases. This is recommended for large pathway databases (e.g., with over 500 pathways) which can be computationally expensive to run on the server. If you do opt to submit your own results, you can download the gene sets from the home page and run GSEA or ORA by your preferred method or by cloning the branch on the DecoPath github page and following the instructions on the README.
Details on how to prepare the files for upload can be found in the FAQs.
Run enrichment analysis
For users opting to run analyses using DecoPath, the workflow depends on the analysis you select. Users can select which of the four pathway databases they would like to include in the analysis. By default, genesets from DecoPath which contain merged equivalent pathways are also included in the analysis.
Detailed information on what types of data you can submit and information on how you can prepare the files for upload can be found in the FAQs.
We recommend downloading experiment results from the results page so analyses do not have to be run again and you can upload files and use DecoPath functionalities at any time.
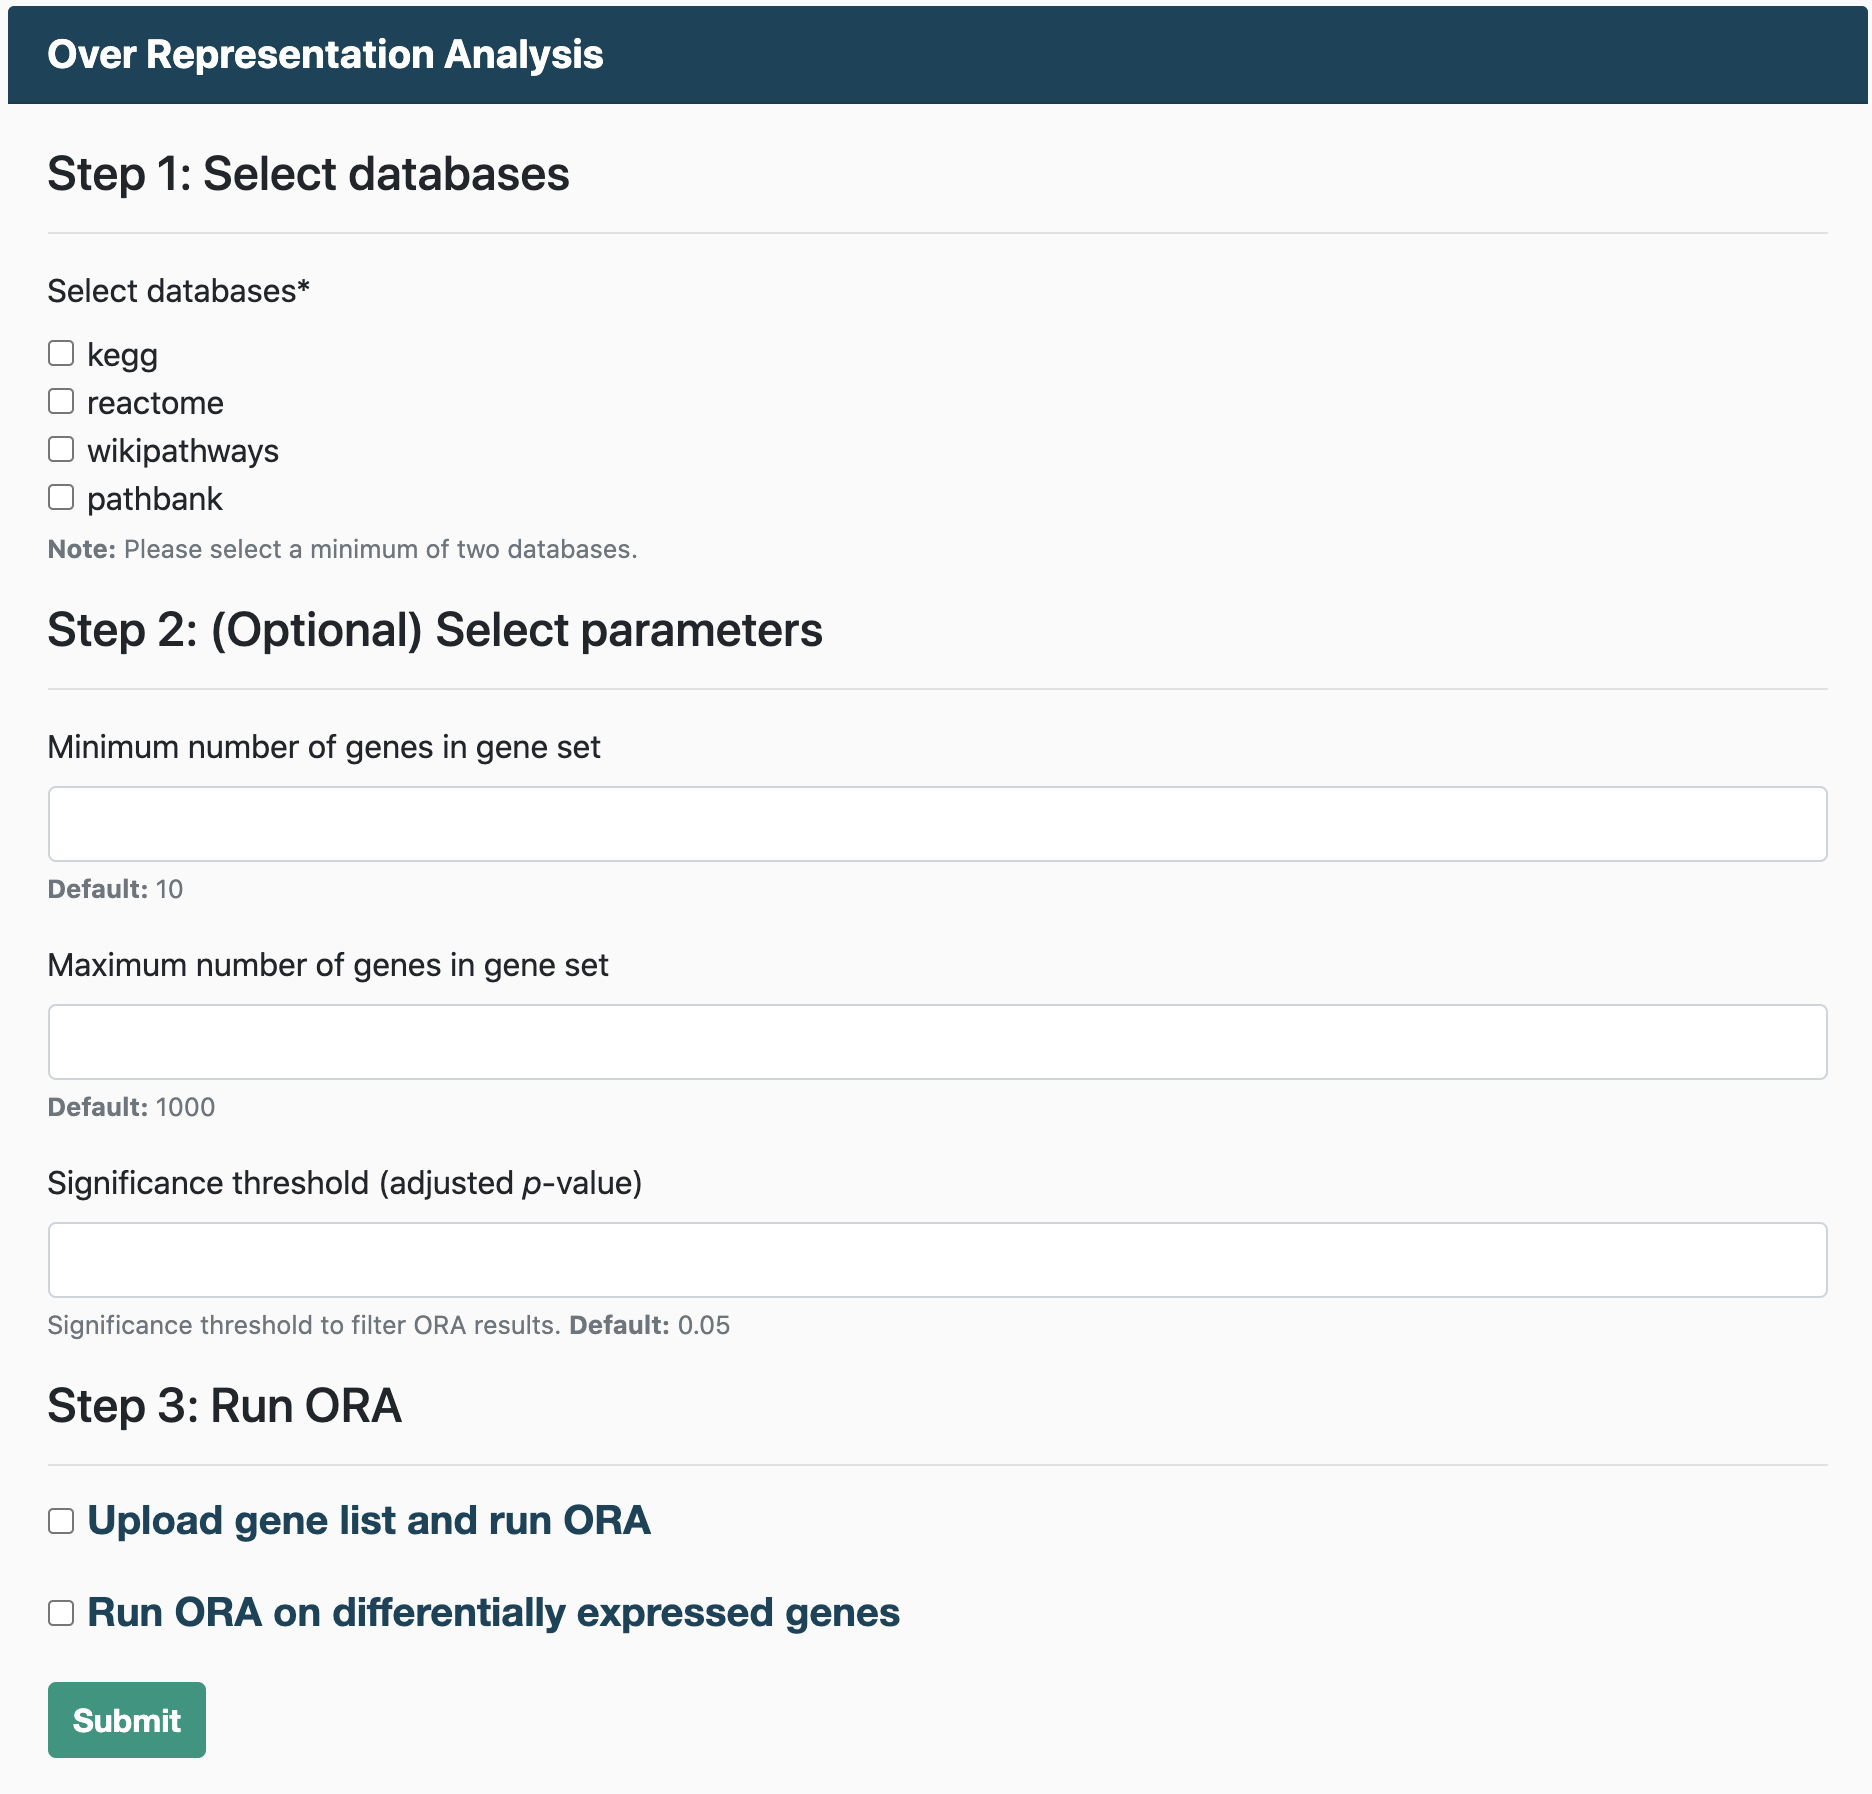
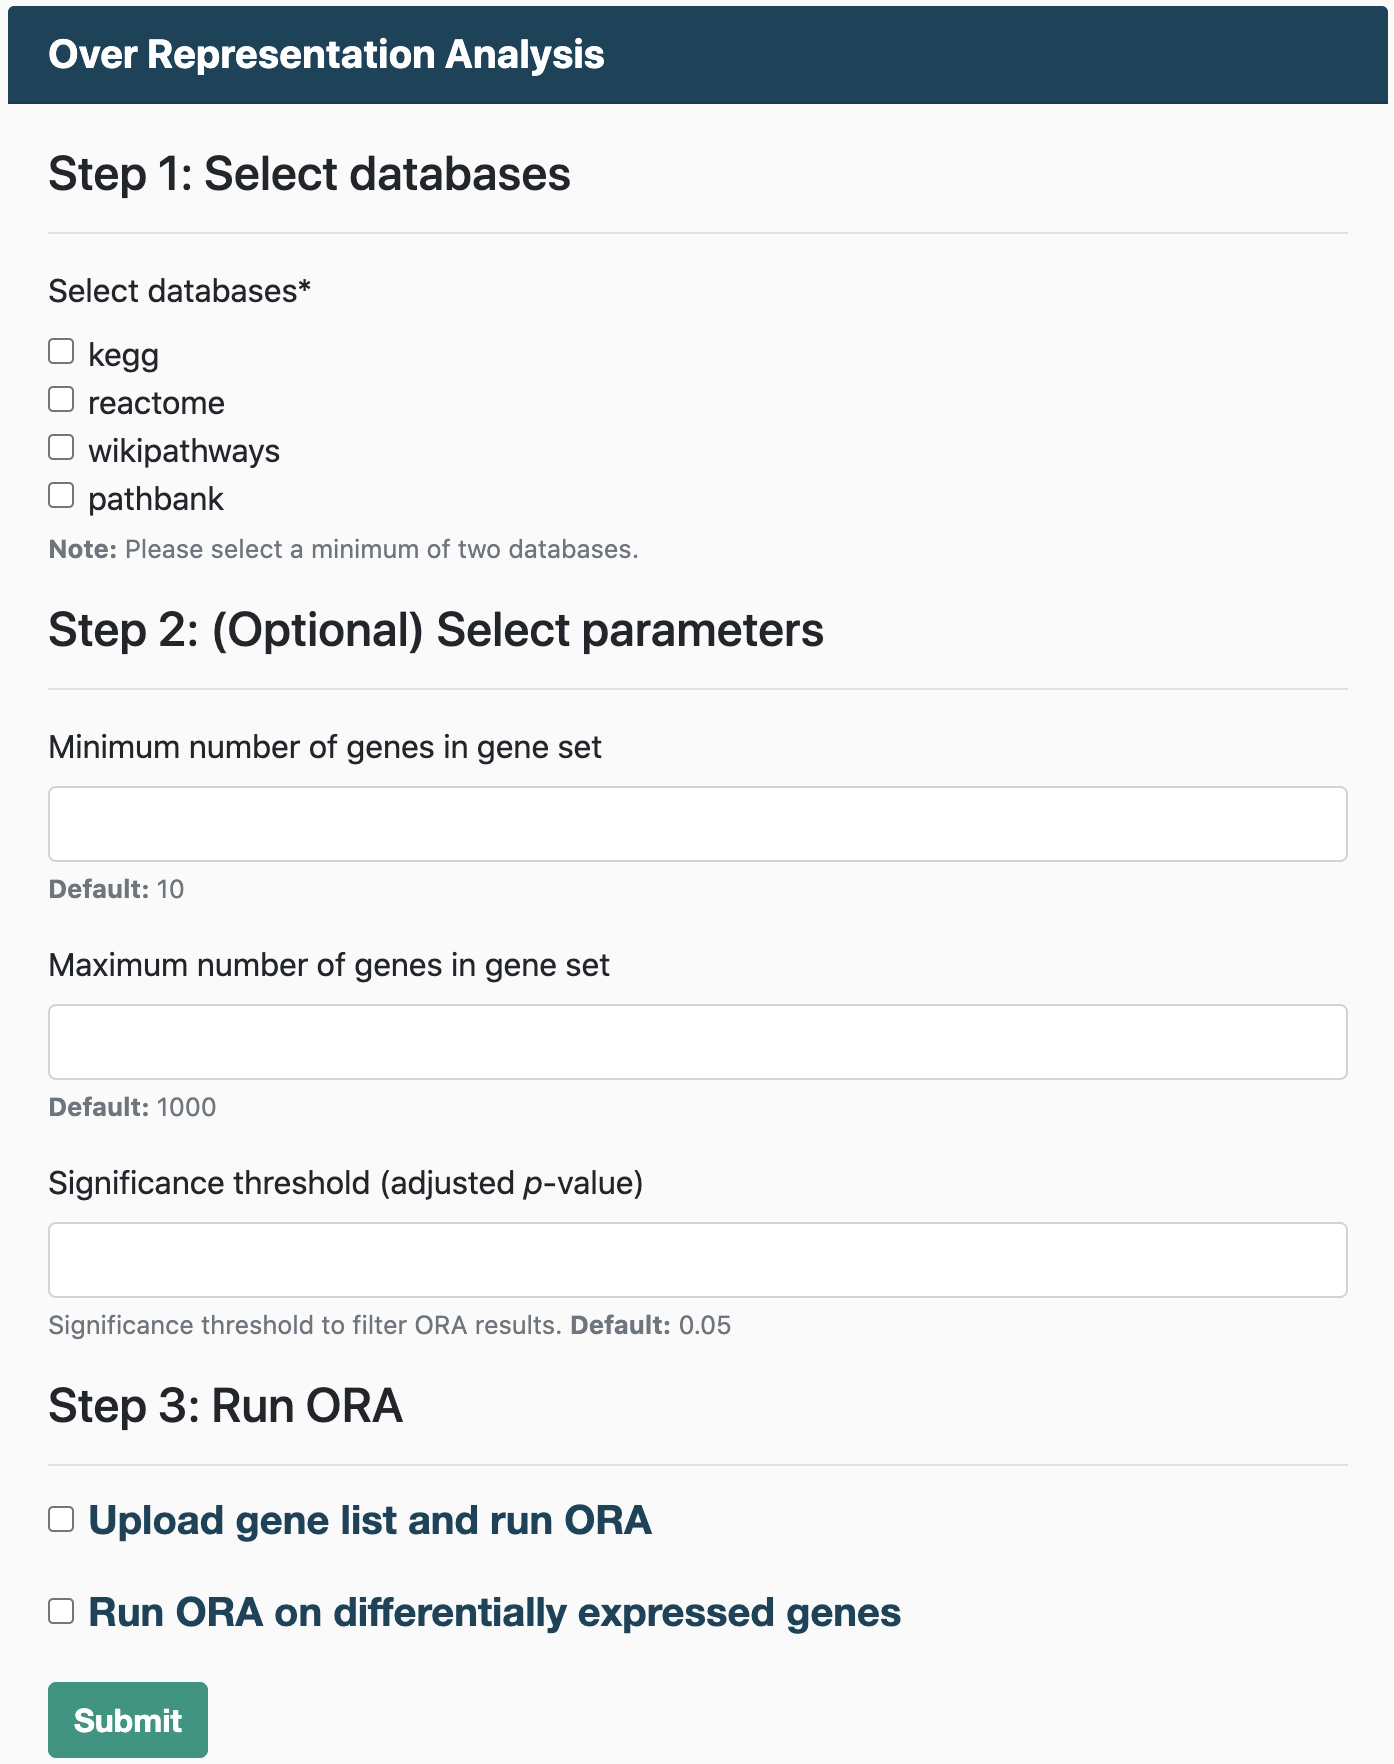
Over Representation Analysis
Running ORA requires:
- A gene list
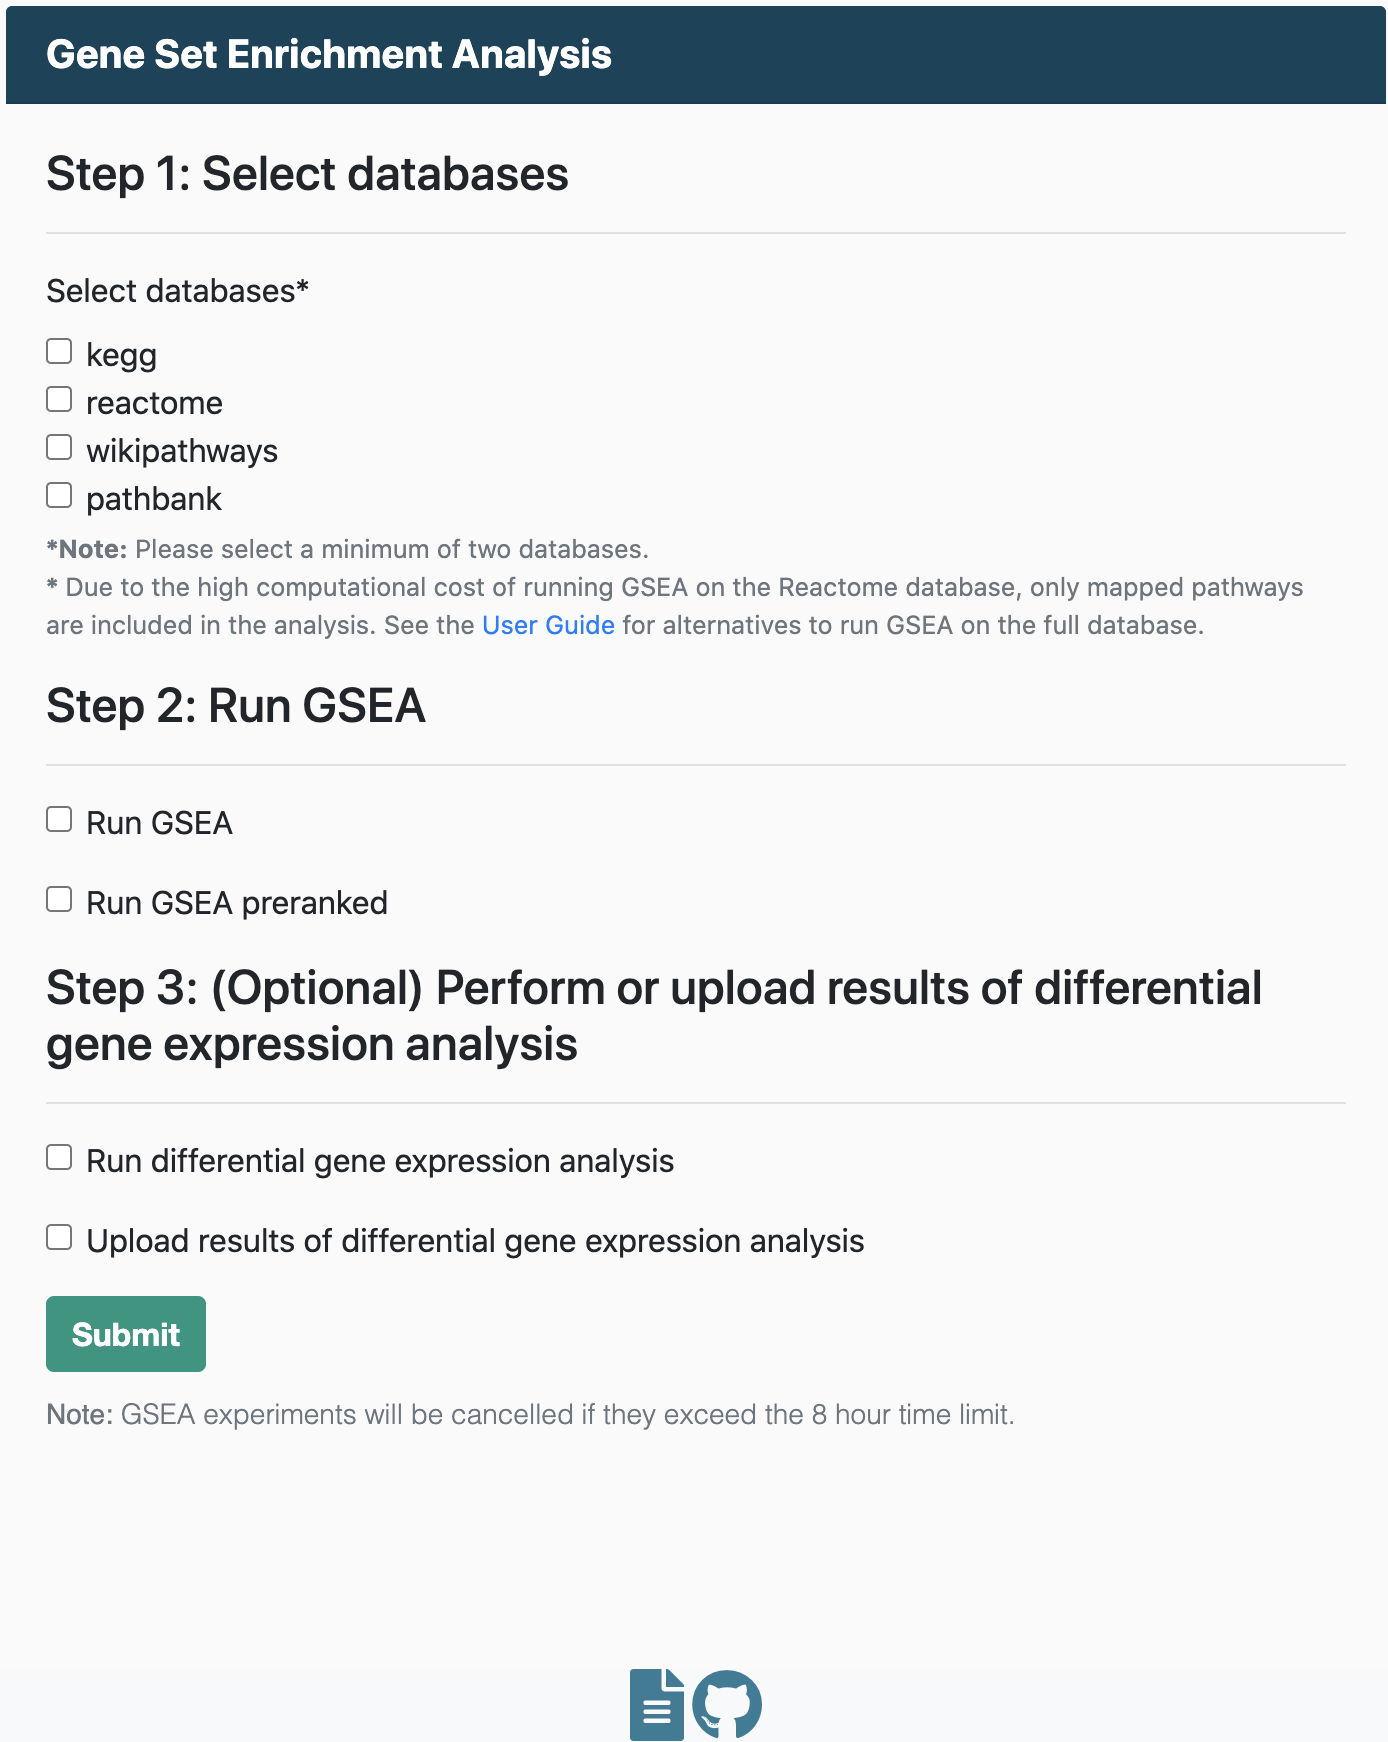
Gene Set Enrichment Analysis
To run GSEA, you will need:
- An expression dataset
- A file containing class labels (e.g., normal and tumor) for samples in the expression dataset.
Users also have the option to run GSEA on a pre-ranked list of genes. For GSEA pre-ranked, users must upload a file containing a ranked list of genes, similar to an RNK file (Ranked list file).
Differential gene expression analysis
While you can generate visualizations without differential gene expression (DGE) analysis, by conducting this supplementary analysis, you can also analyze pathways at the gene level. This allows users to identify which genes are responsible for any disparate results that may be observed across databases.
Further details on this analysis can be found in the FAQs.
We recommend downloading DGE analysis results from the Gene-Level Analysis page so analyses do not have to be run again and you can upload files and use DecoPath functionalities at any time.
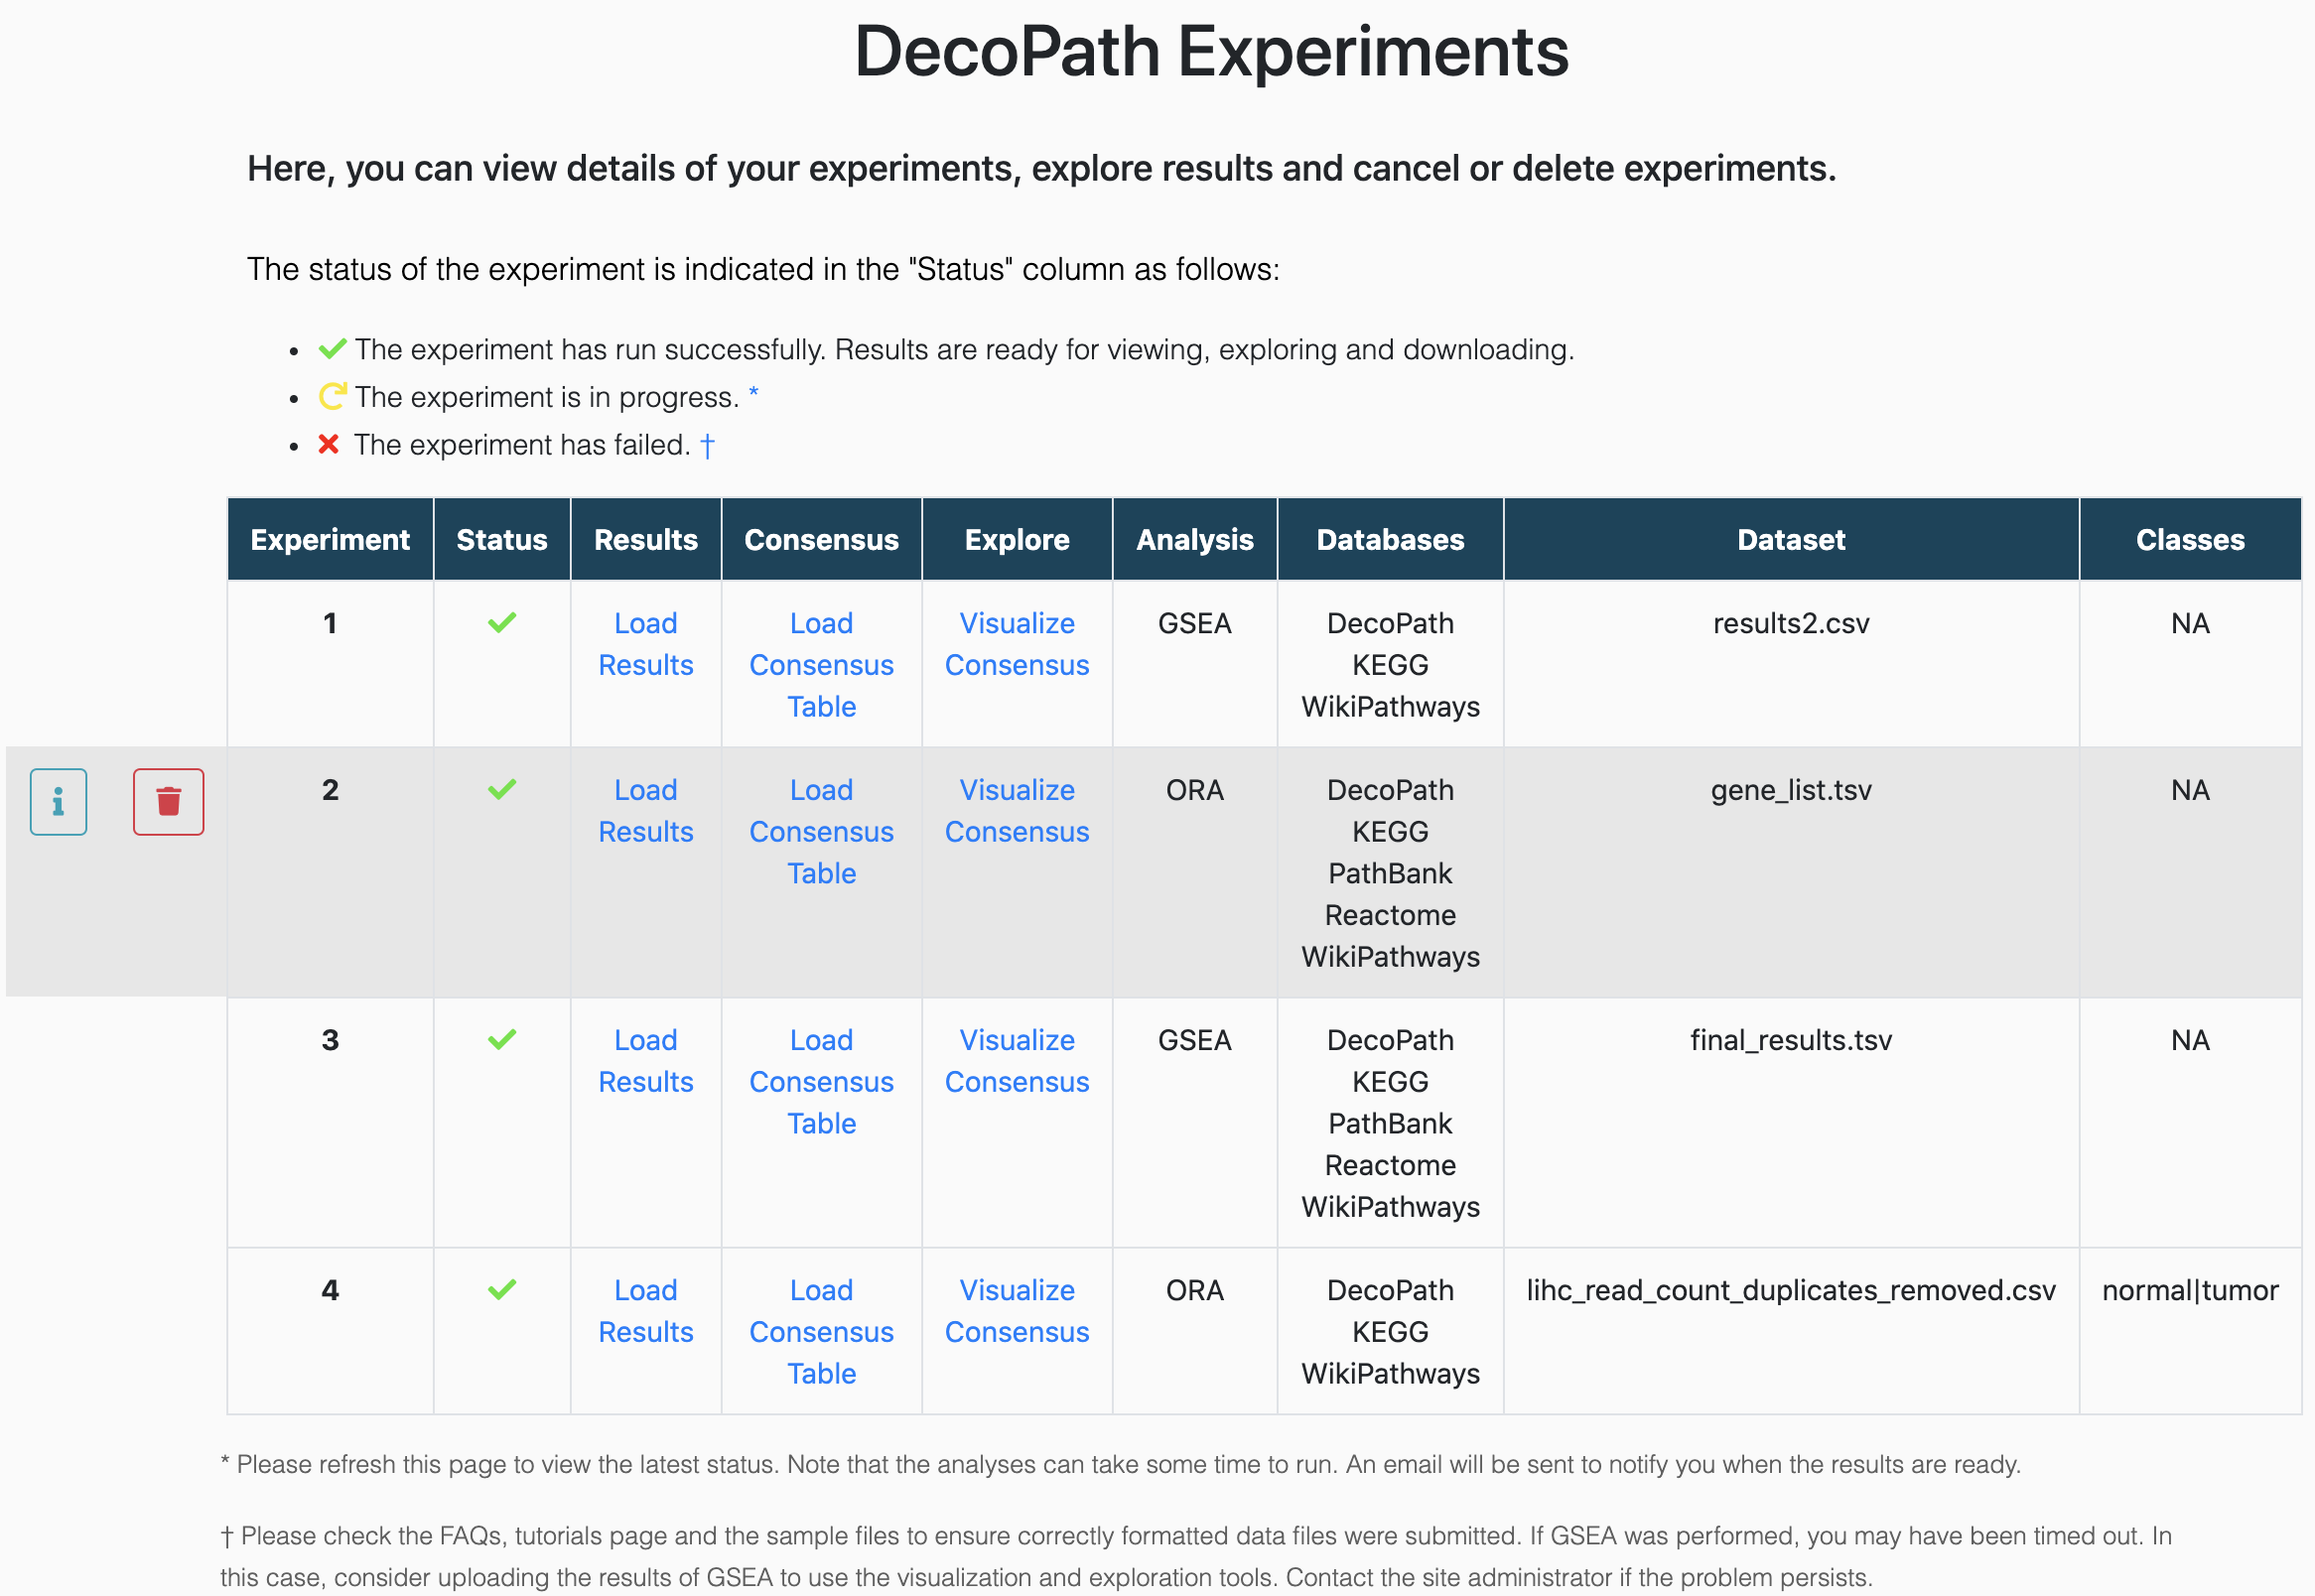
Experiments page
Once you have submitted an experiment, you can find it on the Experiments page along with details on whether it has run successfully, is pending or has failed. You can refresh the page for the latest status.
If the experiment has failed, you can click on the X icon in the "Status" column to see what the issue may have been.
Note the expected run times for an analysis:
- ORA: 0-10 minutes
- GSEA: 10-120 minutes
- DGE analysis: 5-30 minutes
Exploring results
Results page
This page summarizes the results of the pathway analysis performed. For ORA, this includes details on the pathway and the q-value denoting whether the pathway is enriched in the gene list. For GSEA, the report also includes the (normalized) enrichment scores for each pathway.
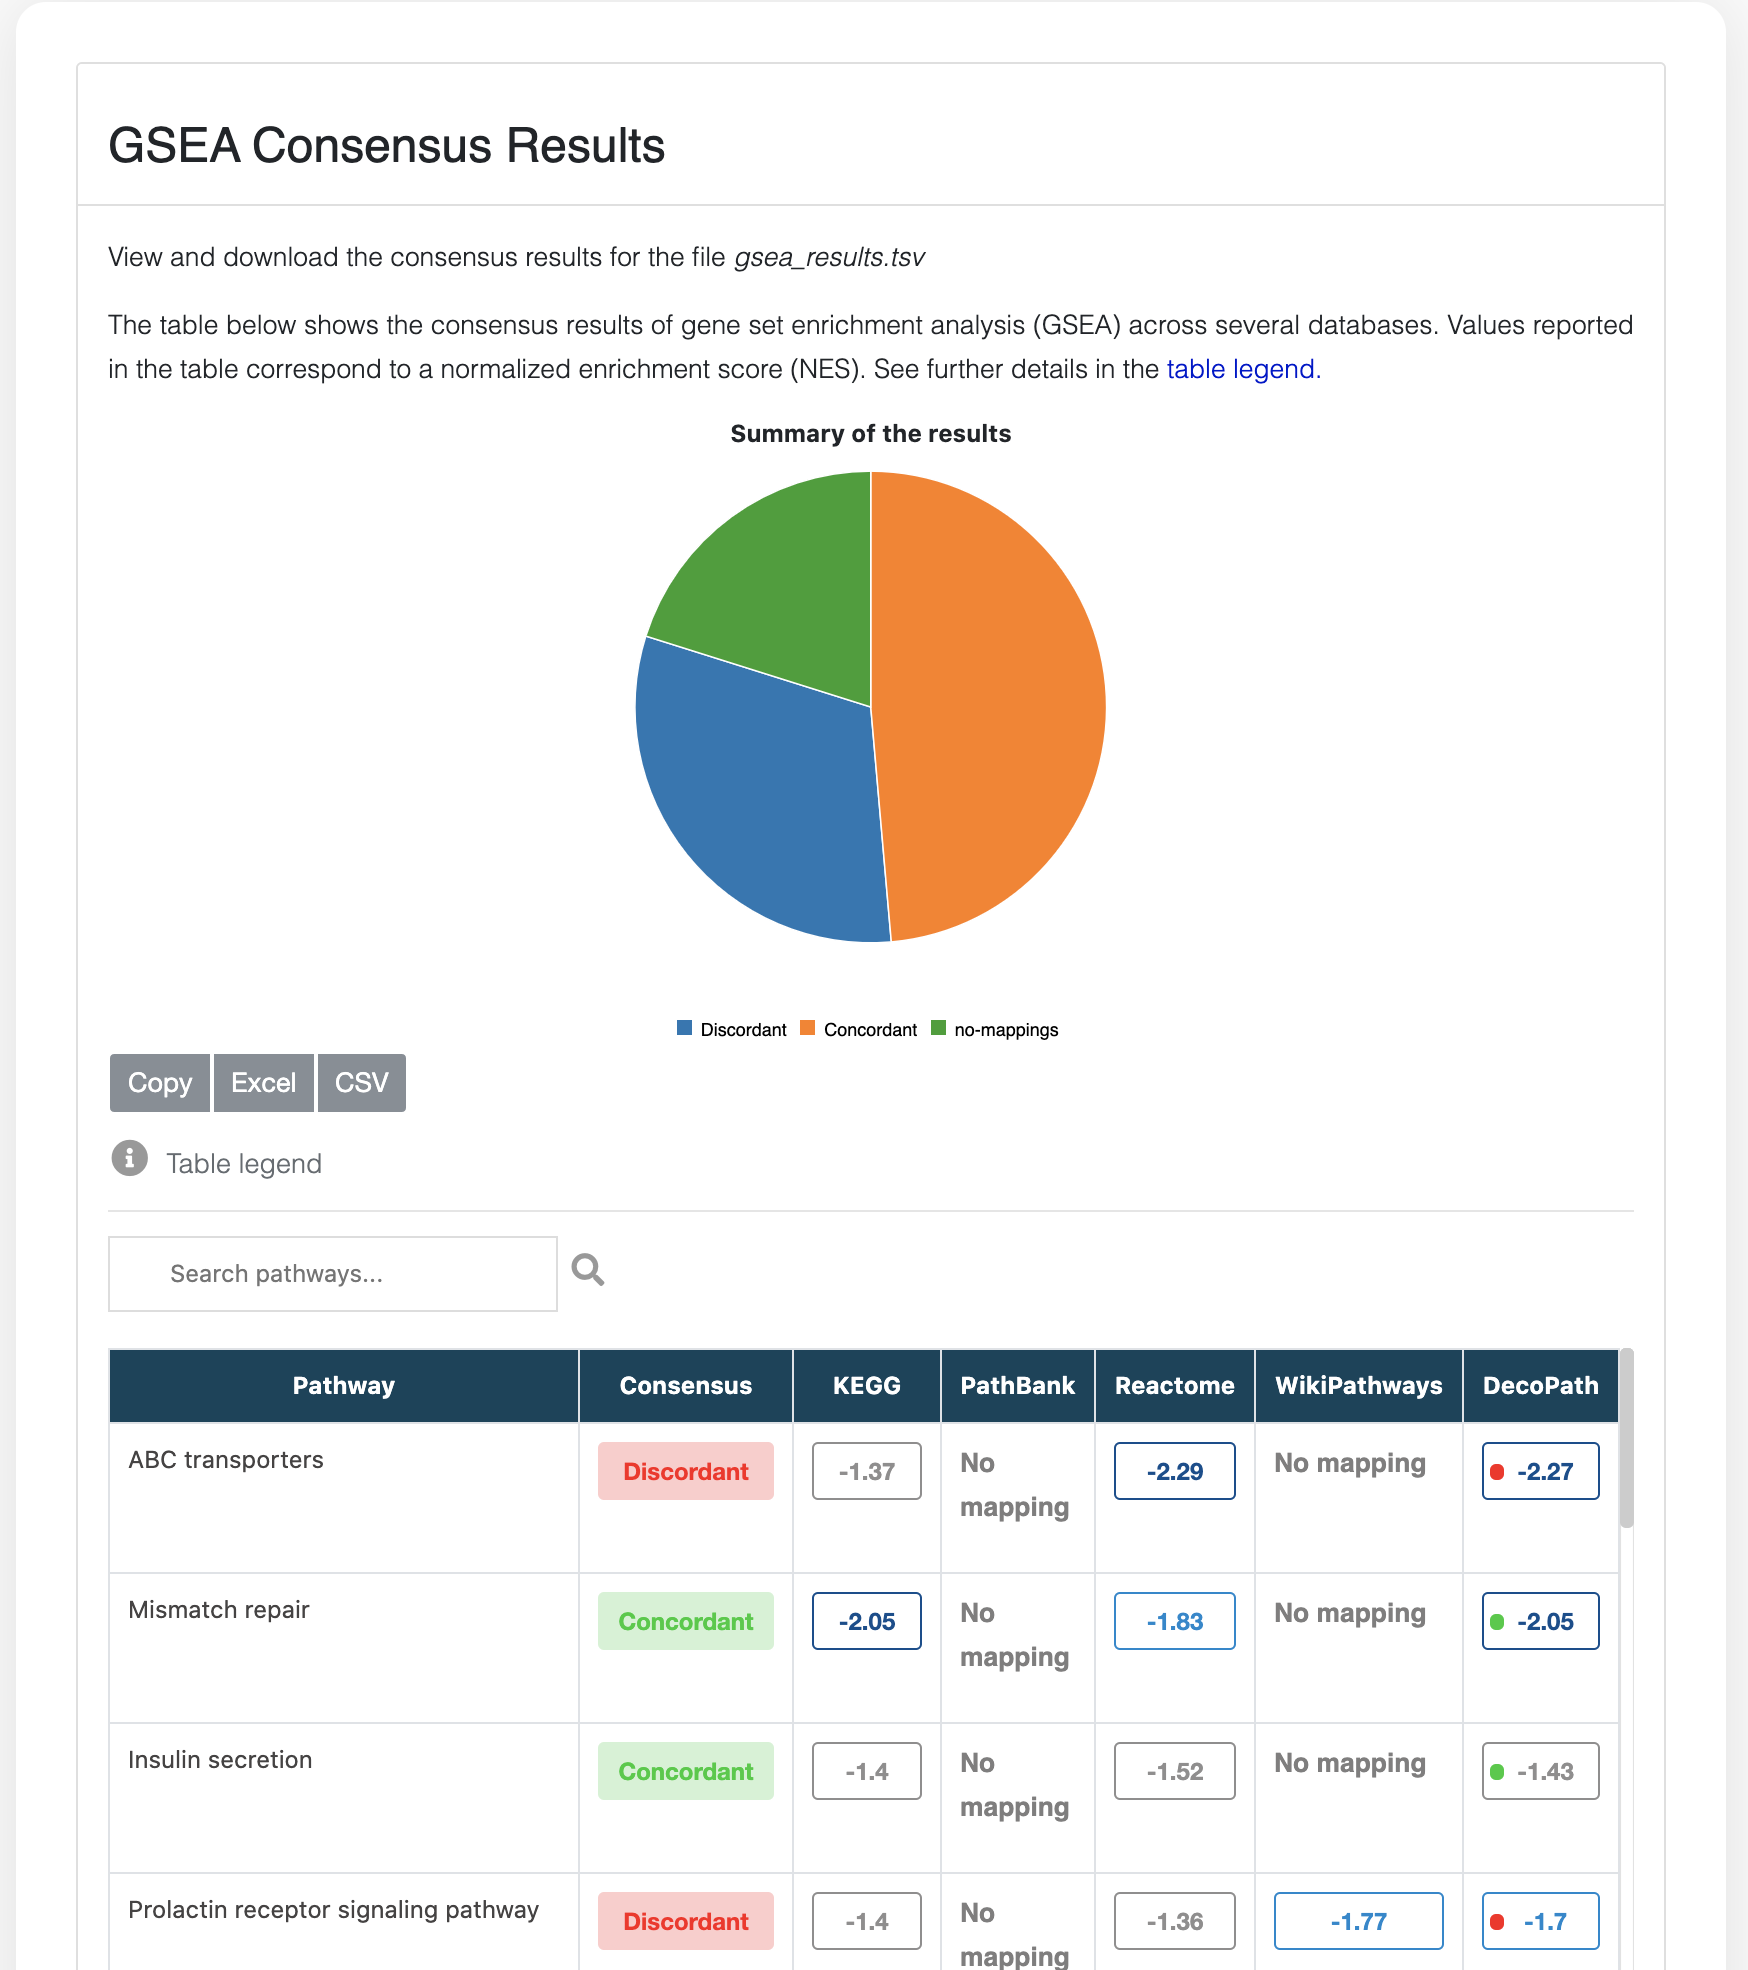
Consensus table
The Consensus page visualization shows the consensus of the results of enrichment analysis across databases at the pathway level.
For GSEA, the table displays the normalized enrichment score (NES) for a given pathway across each database as well as the NES of the merged gene sets of all equivalent pathways in the column “DecoPath”. Pathways that are not significantly enriched according to a user-defined cut-off are coloured gray. Similarly for ORA, the table shows the q-value for a given pathway across each database and pathways that are not significantly enriched are coloured gray.
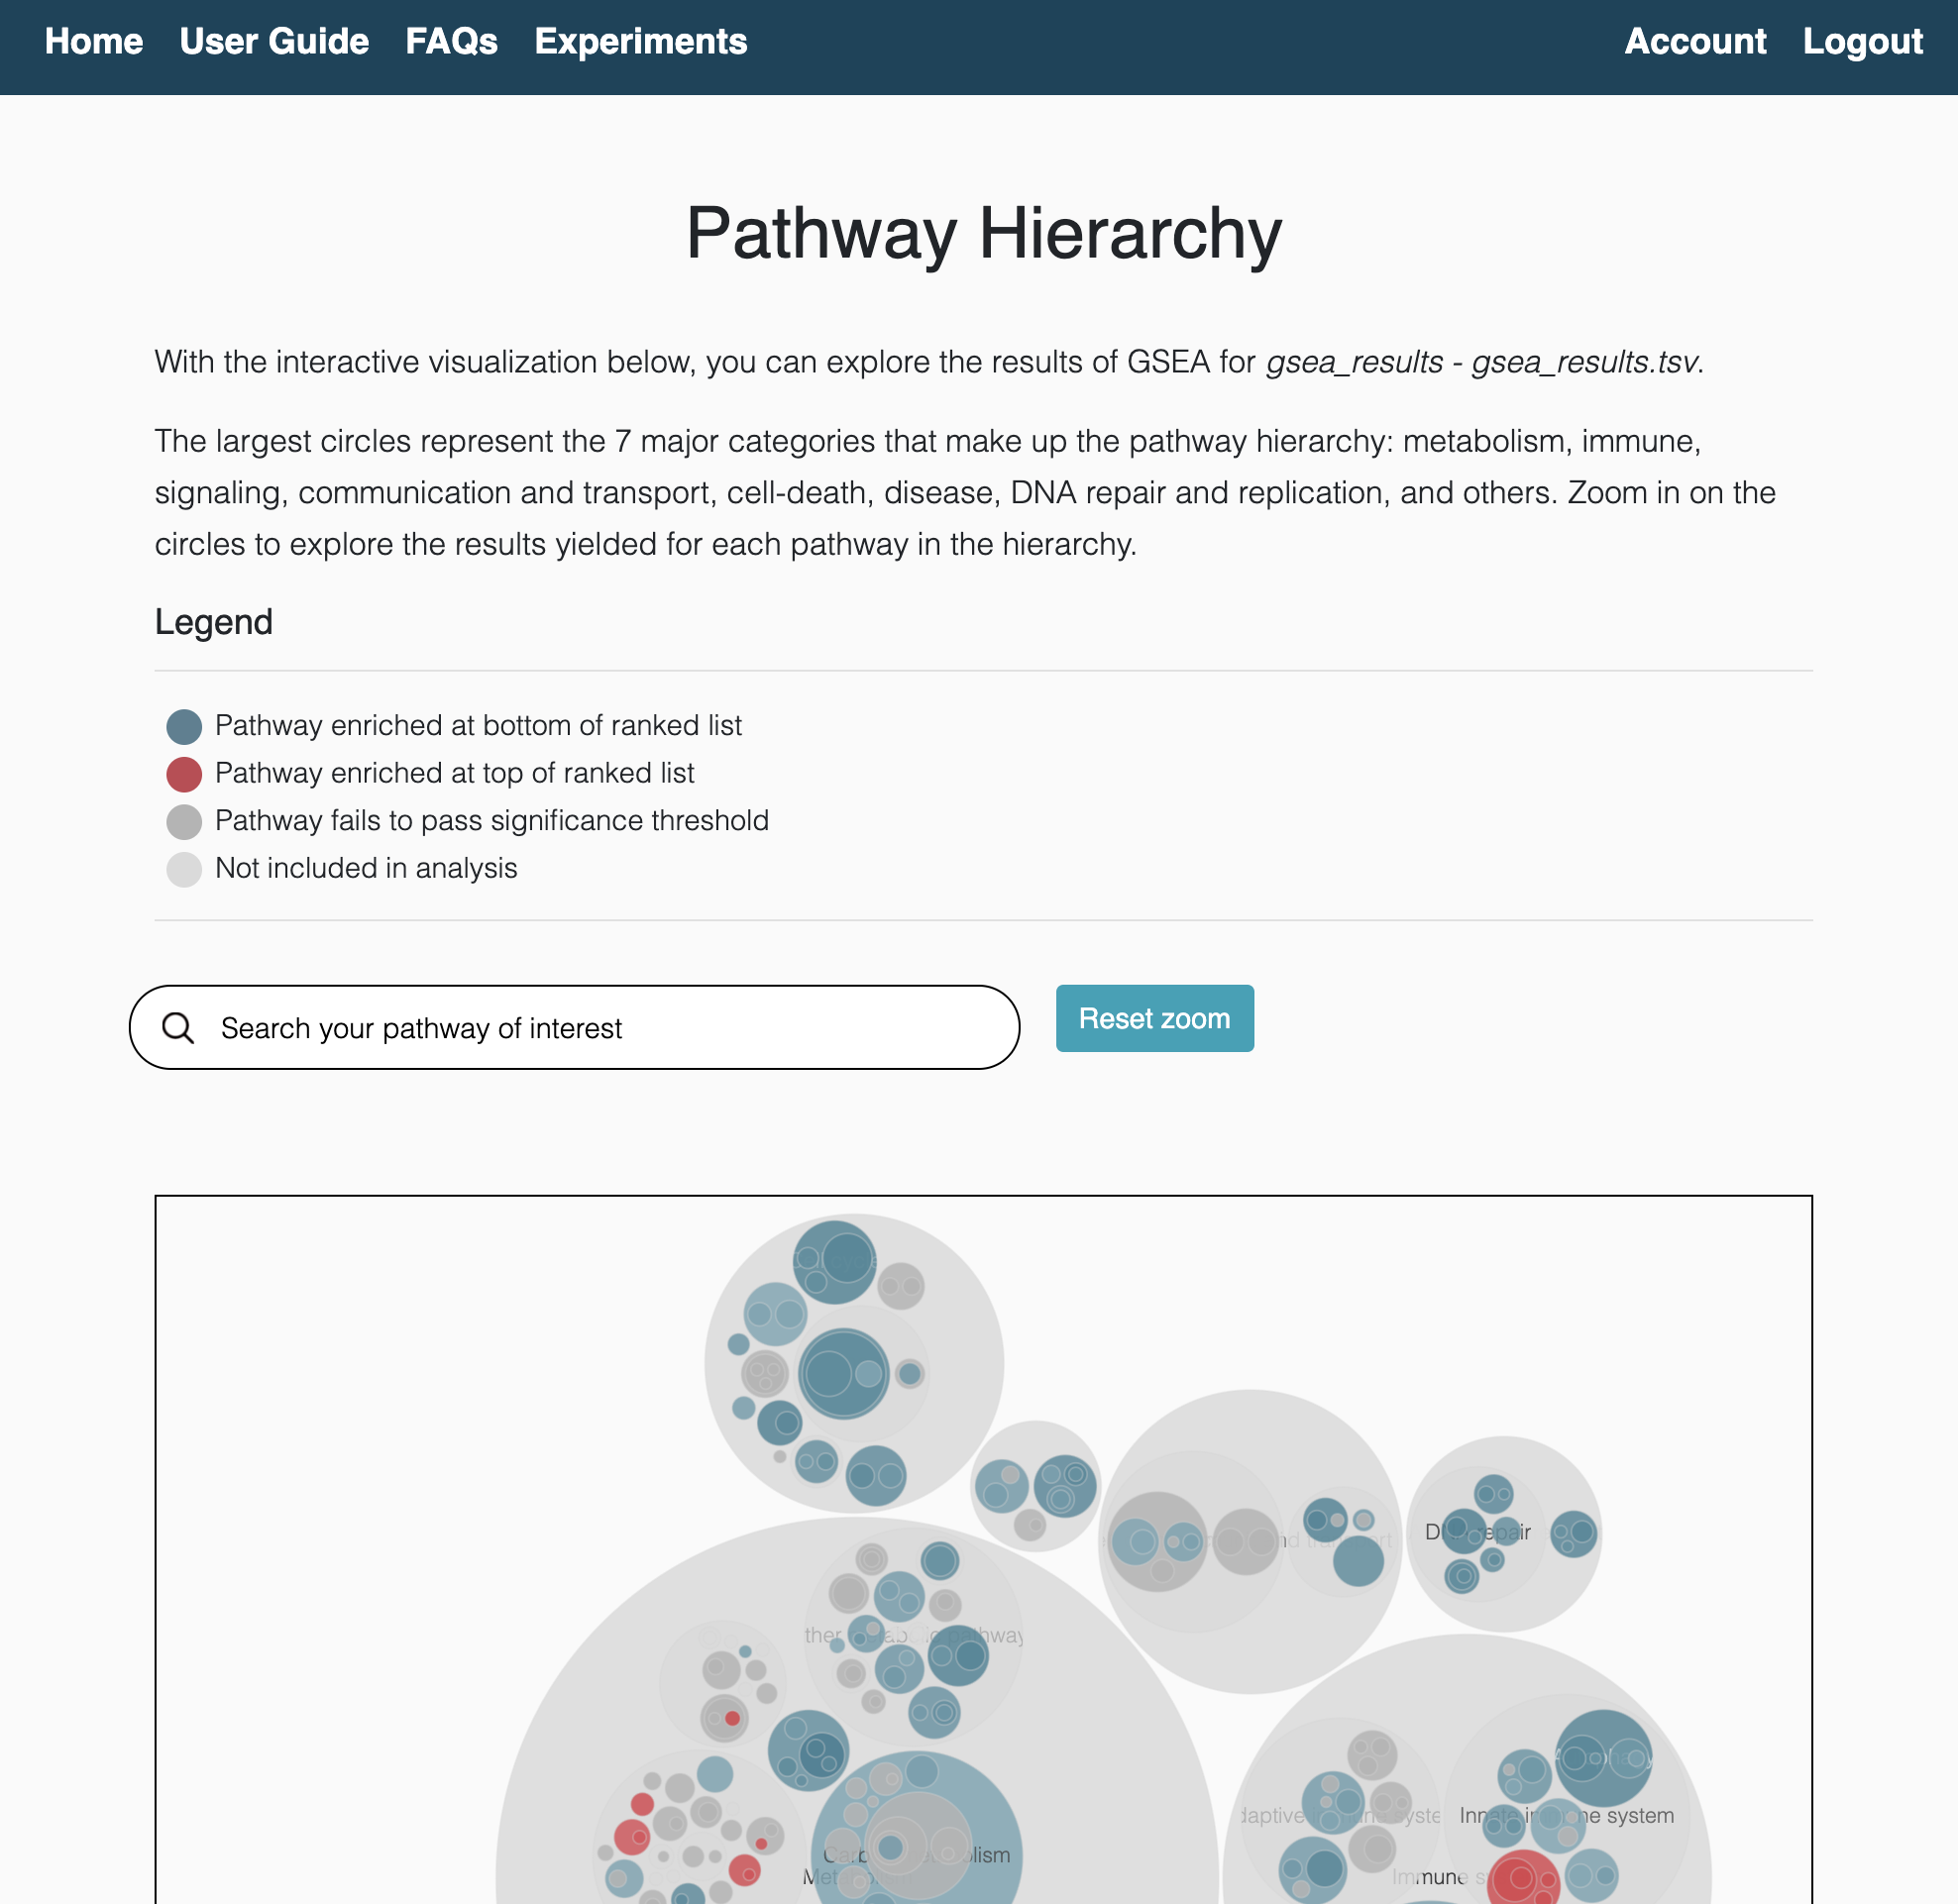
Hierarchical view
The hierachical view is an interactive visualization of equivalent pathways across databases. The organization of pathways into major categories allows users to intuitively navigate through the hierarchy and identify the consensus (or discrepancies) around enriched pathways. These pathways are categorized into 8 major categories:
- Metabolism
- Immune system
- Signaling
- Communication and transport
- Programmed cell-death
- Disease pathways
- DNA repair and replication
- Others
In total, the hierarchy contains 644 pathways and can be found here.
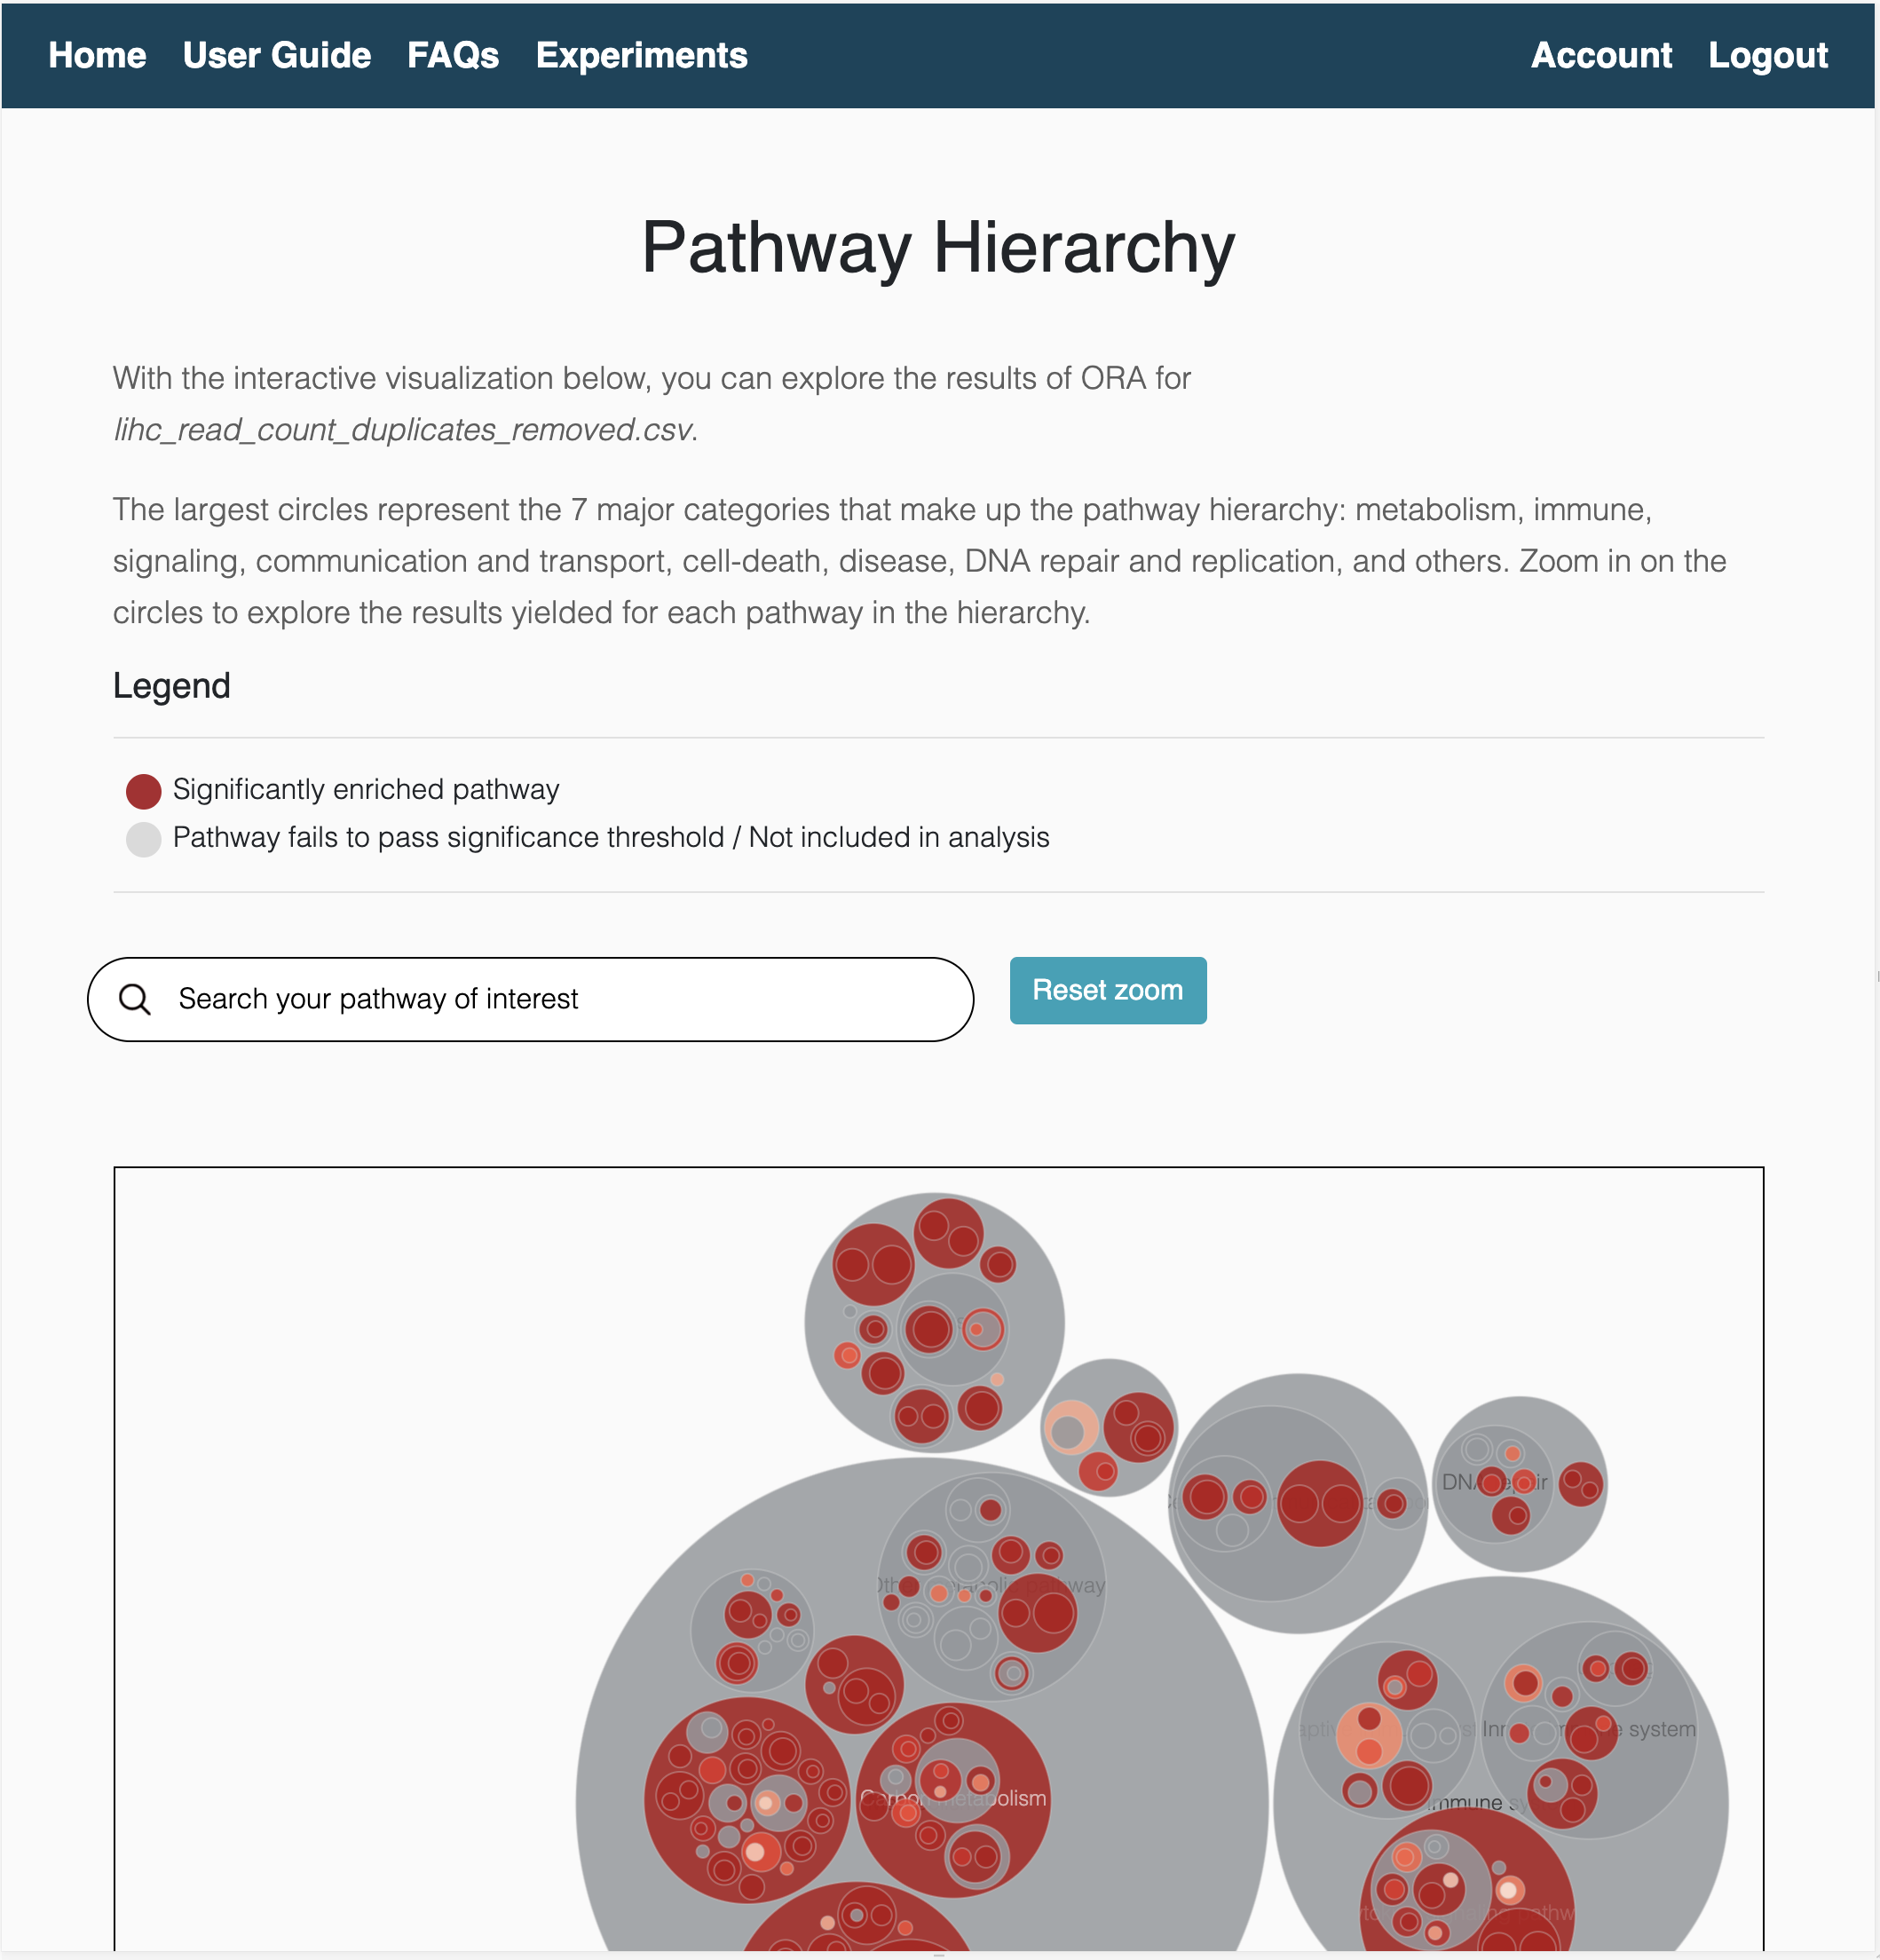
ORA results hierarchical view
GSEA results hierarchical view
Gene-level analysis
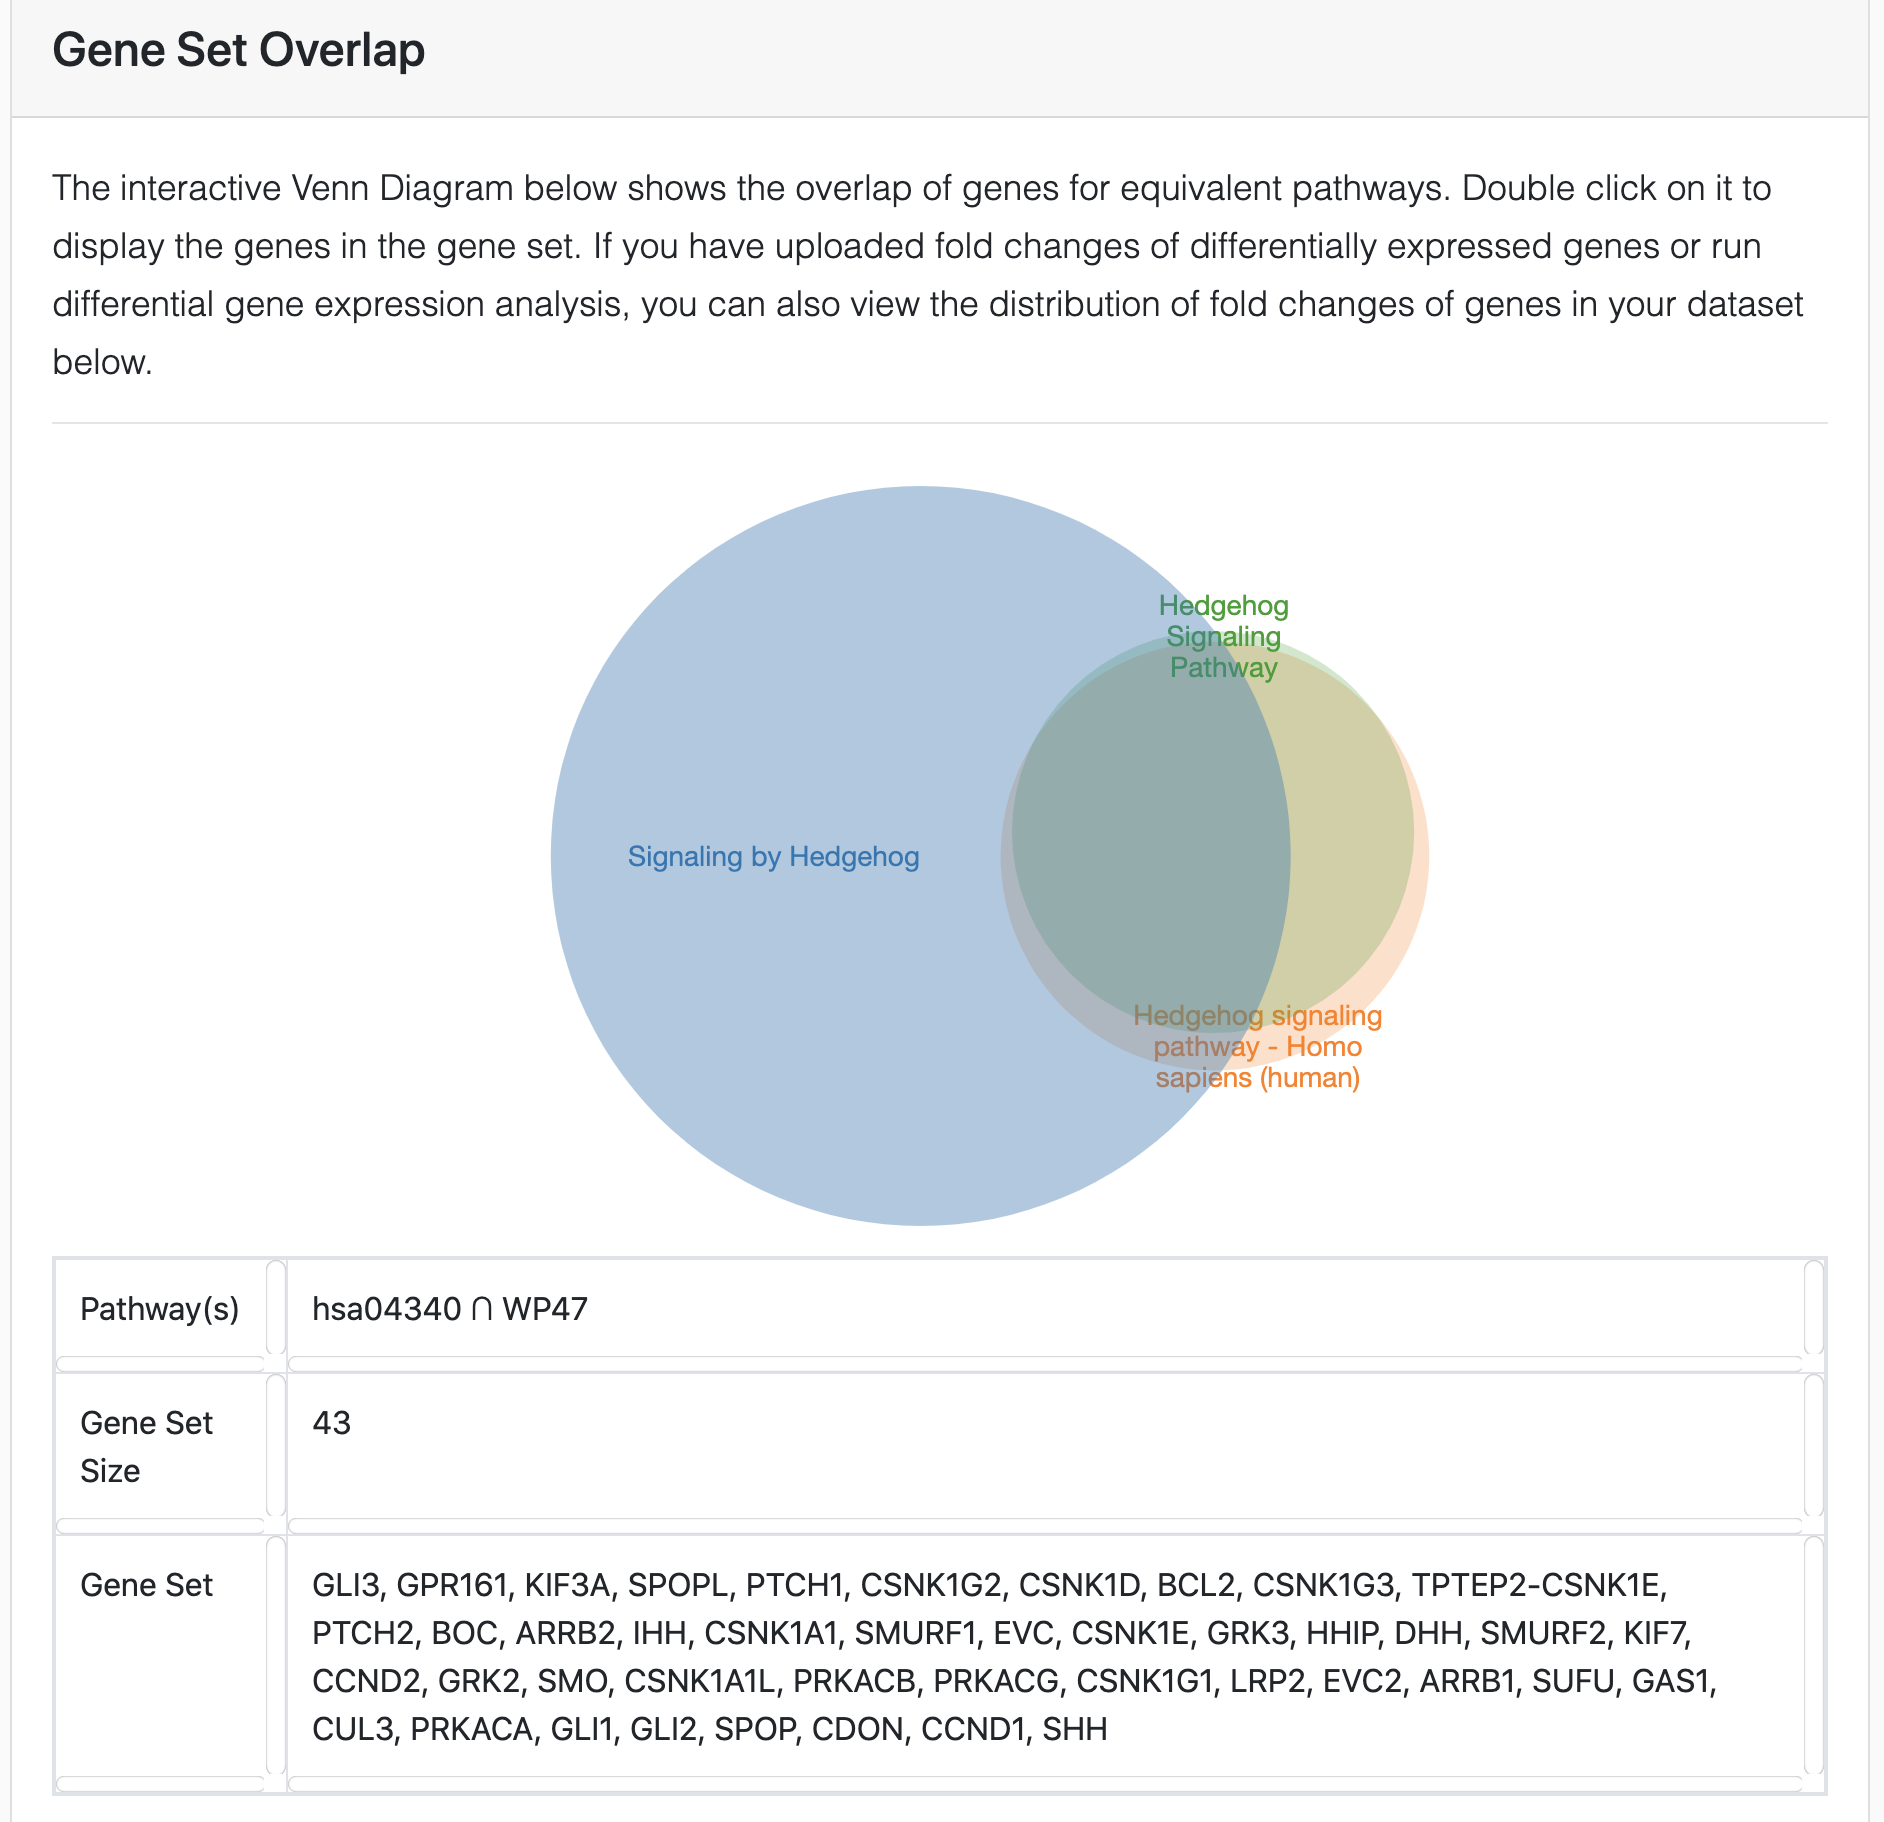
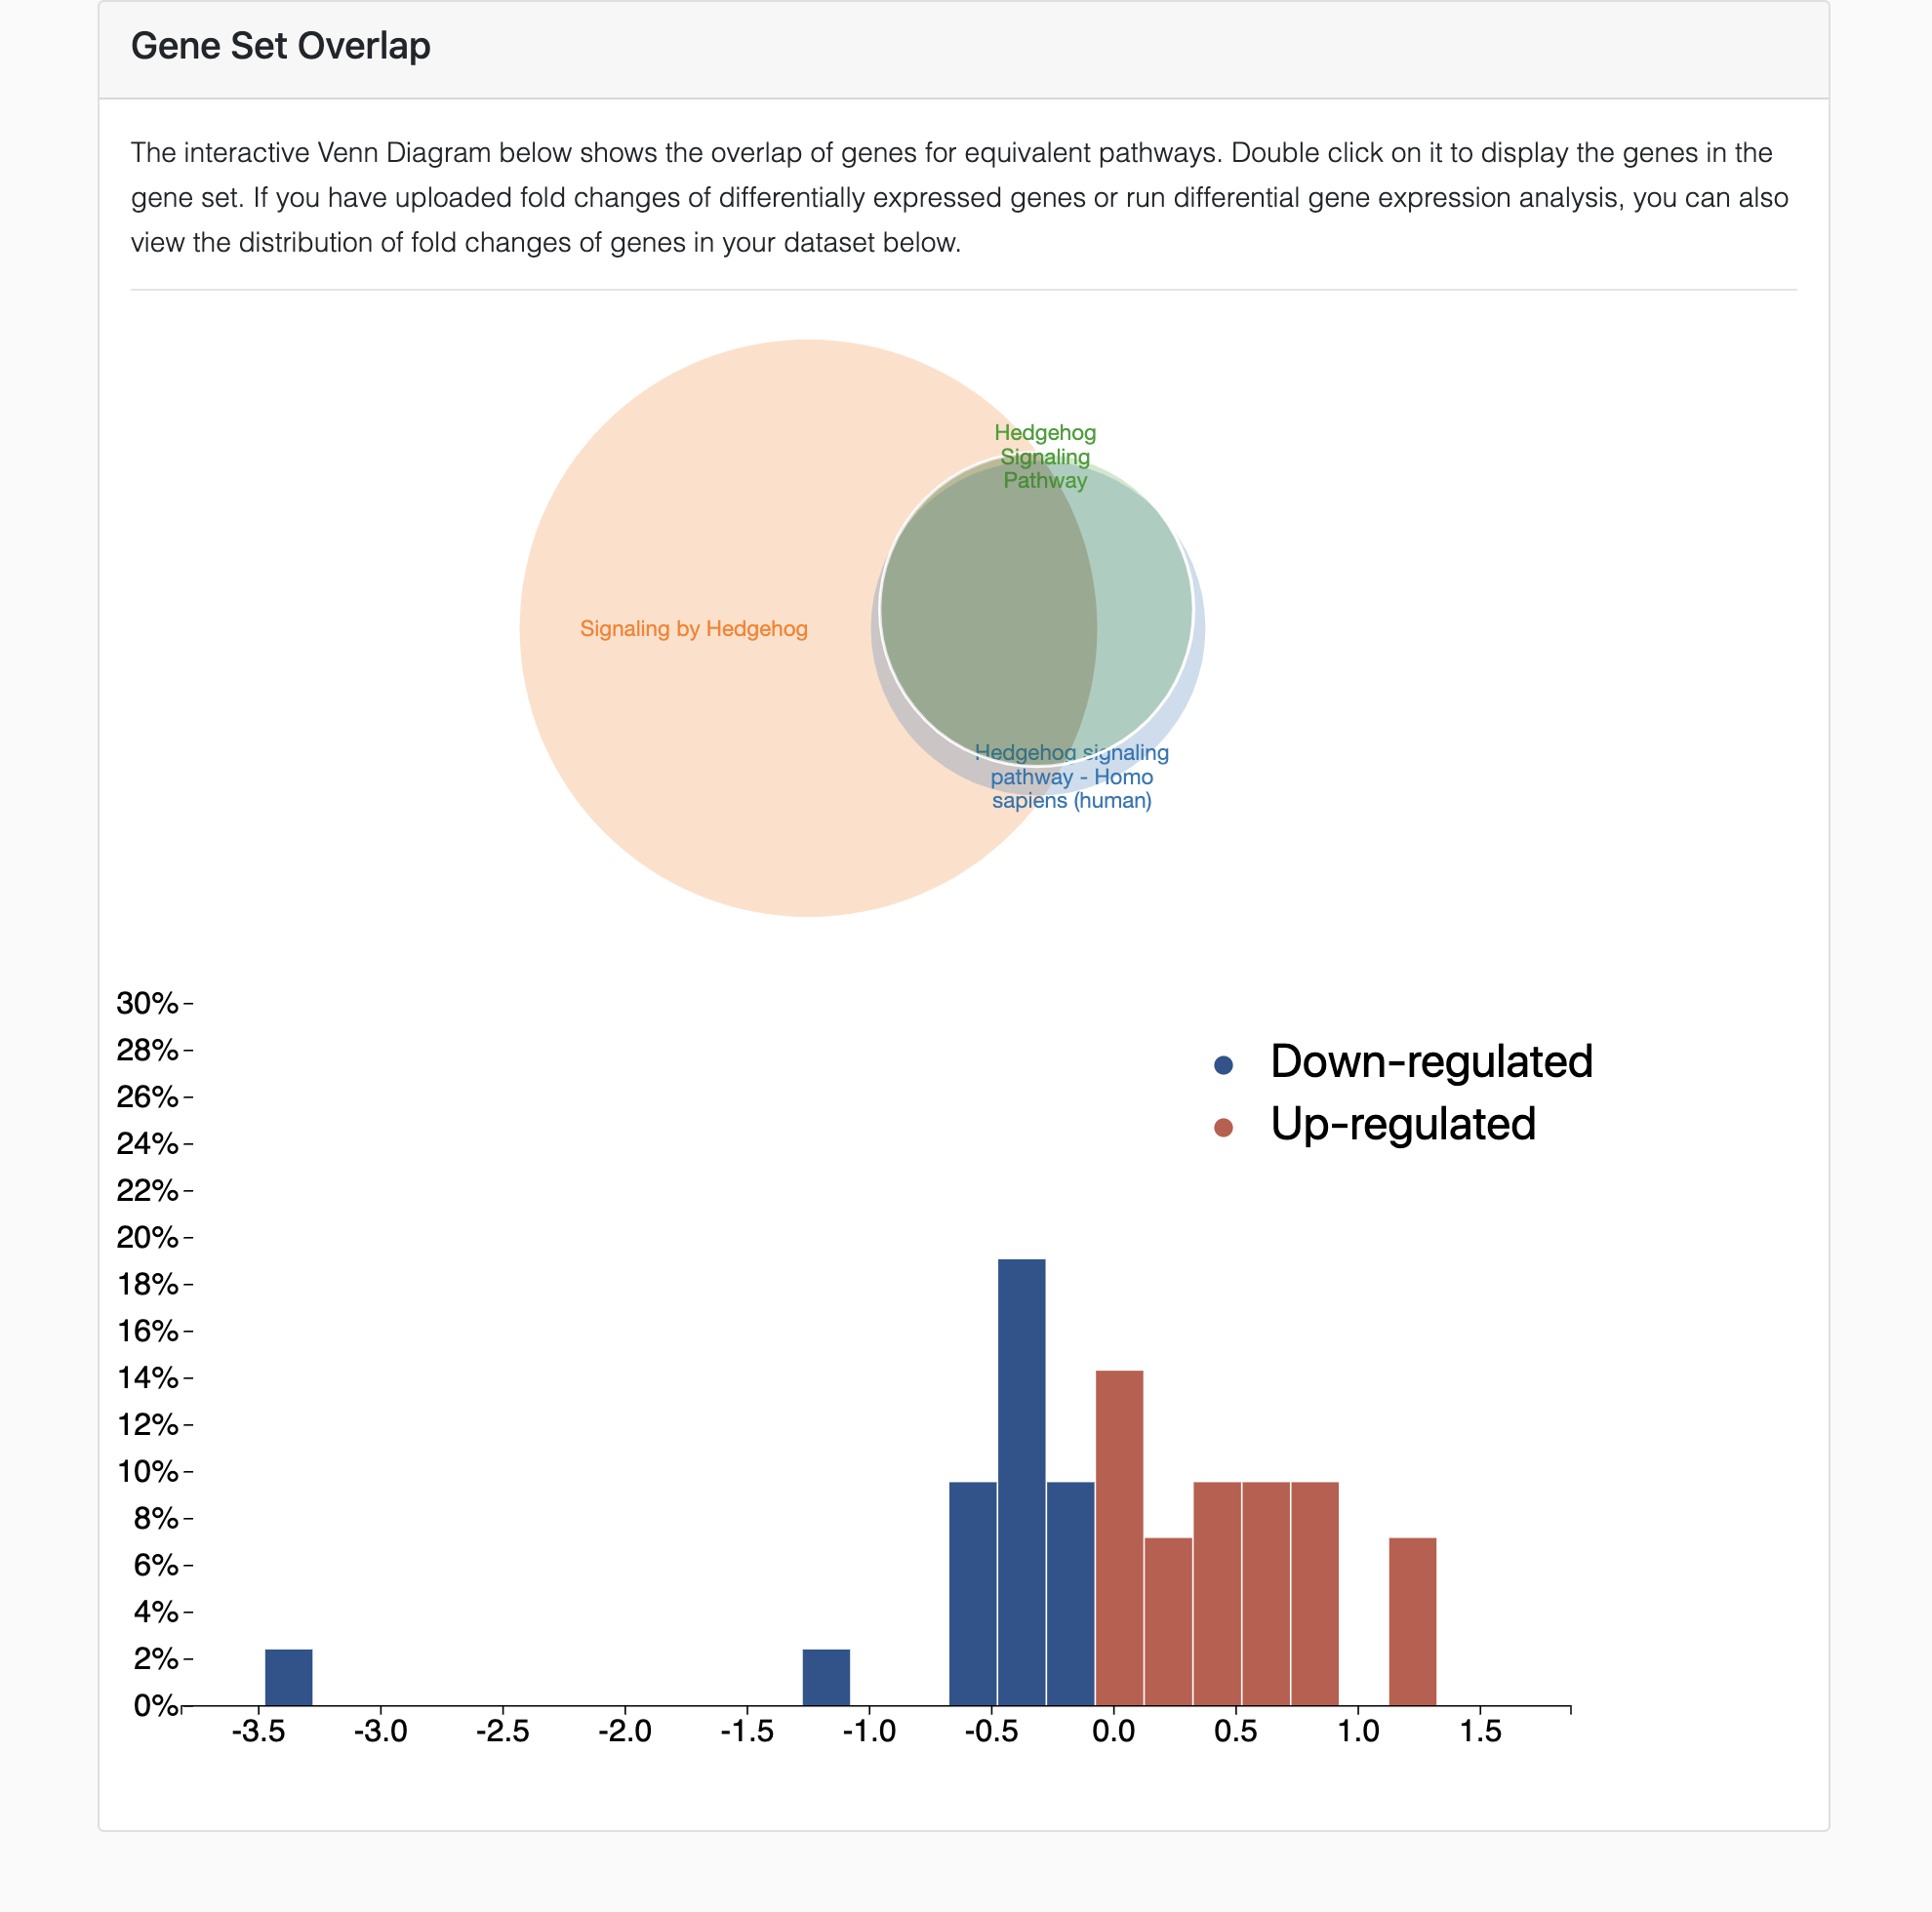
This interactive visualization shows the overlap of genes for equivalent pathways to pinpoint specific genes that may contribute to the contradictions observed in the results of enrichment analysis. If you have uploaded fold changes of differentially expressed genes or run DGE analysis, you can also view the distribution of fold changes of genes in your dataset.
In the images below, we zoom-in on the results of GSEA using KEGG, WikiPathways and Reactome for a liver cancer dataset. We focus on the database-specific results for the hedgehog signaling pathway.
With a supplementary DGE analysis, you can plot the distribution of fold changes for differentially expressed genes in your dataset to identify which genes are leading to either consistent or contradictory results of the pathway analysis.
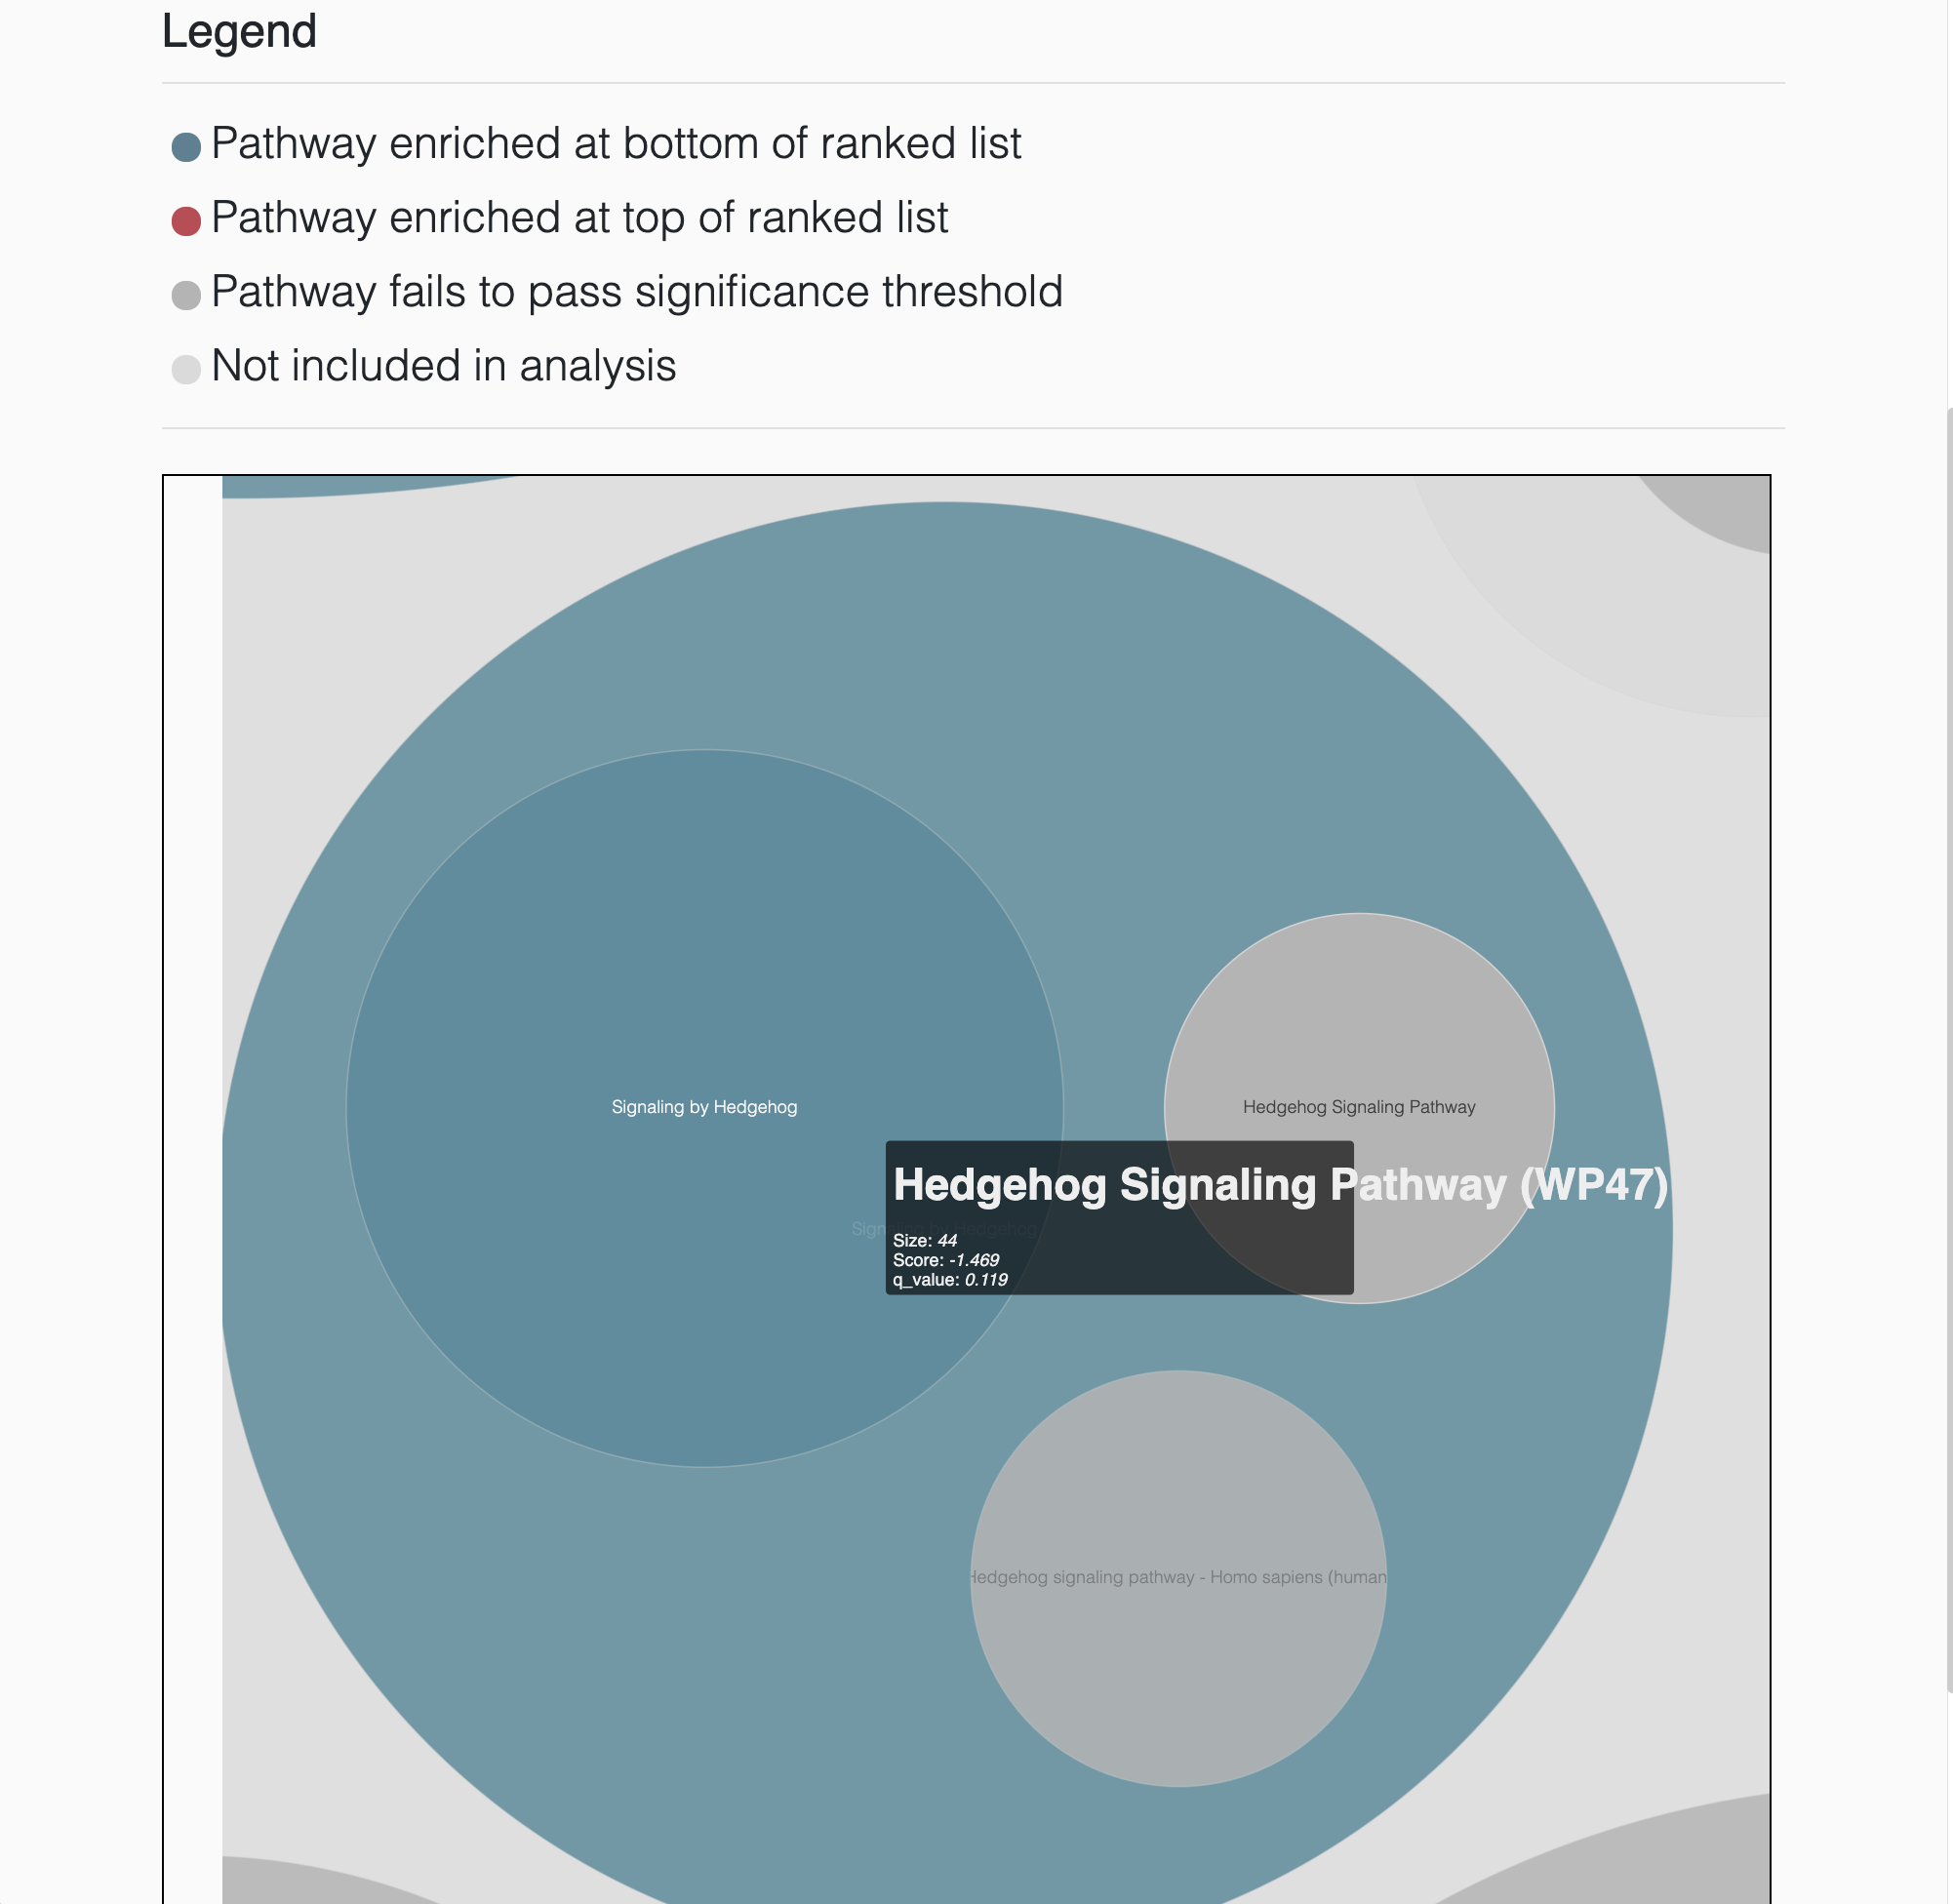
Example GSEA results in which the hedgehog signaling pathway is not significantly enriched using KEGG and WikiPathways (gray circles) but is significantly enriched using Reactome (blue circle).
The Venn diagram depicts the overlap of genes for the hedgehog signaling pathway. Gene sets from KEGG and WikiPathways heavily overlap with each other, but minimally with the pathway from Reactome, explaining why Reactome presents with discordant results.
Plotting the distribution of fold changes for each of the genes in the gene sets illustrates how discordant results arise.
Managing your account
Delete experiment
It's easy to delete an experiment! Just head over to the Experiments page, hover over the experiment you want to delete, and click on the trash can icon.
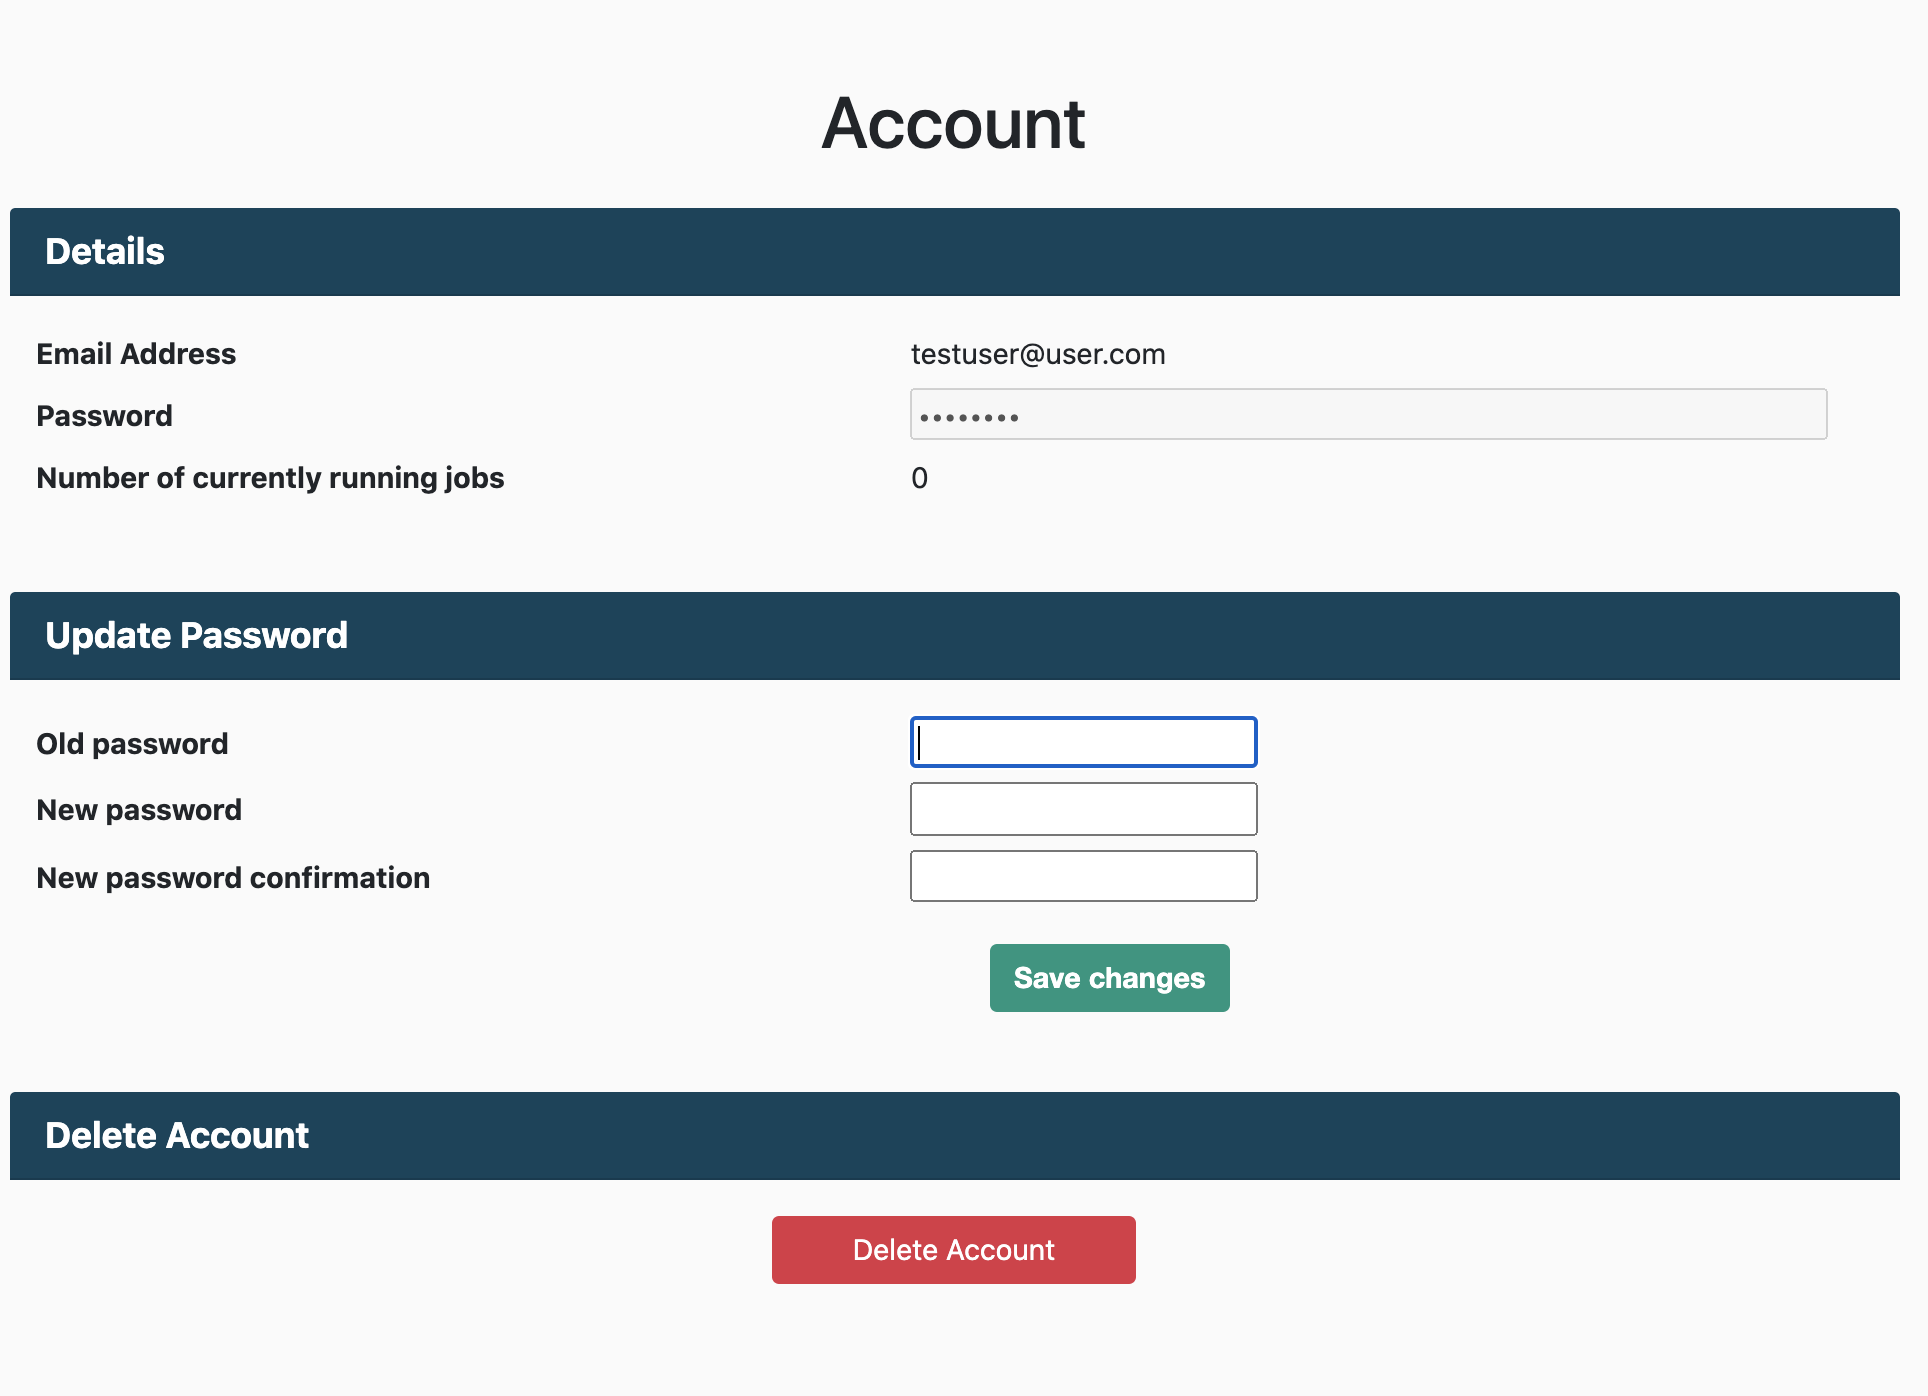
Delete account
Deleting your account is also simple. You can delete your account at anytime on the Account page.
Contact us
DecoPath is currently developed and maintained in an academic capacity by Sarah Mubeen, Vinay Srinivas Bharadhwaj and Daniel Domingo-Fernández at the Fraunhofer SCAI Department of Bioinformatics.
Write us an email, report a bug or send us a feature request at sarah.mubeen@scai.fraunhofer.de. You can also report a bug by creating an issue on our github page.